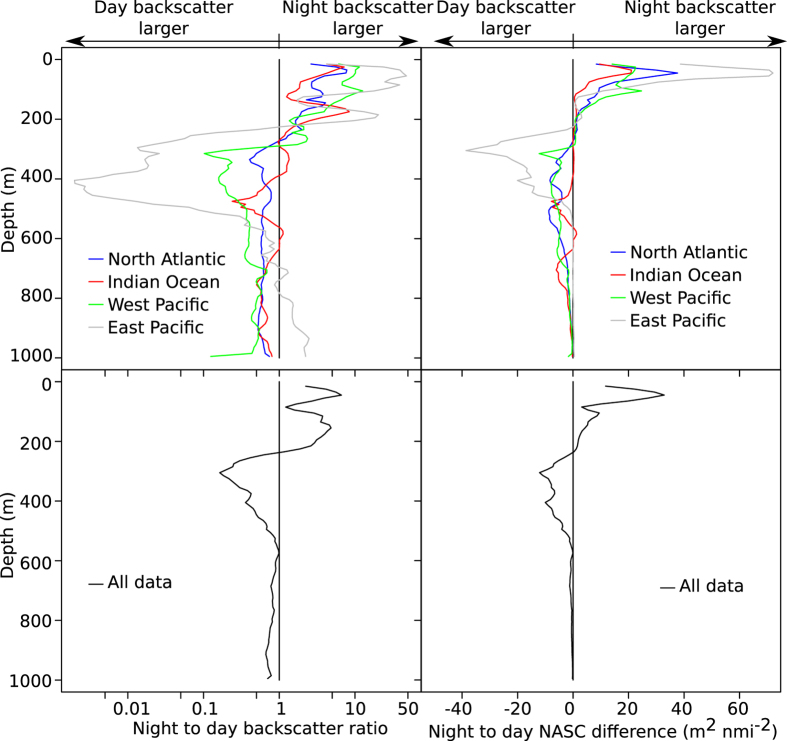
Figure 5. Vertical behavior.
Vertical distributions of night to day backscatter ratios (left) and night to day backscatter differences (right) plotted against depth. Note the logarithmic scale in the backscatter ratio plots. The upper panels shows data from different regions indicated by different colours, blue is North Atlantic ocean, red Indian ocean, green Western Pacific ocean, and grey Eastern Pacific ocean. In the lower panels compound measures for cruise total dataset are given. Whereas the plots of backscatter ratio (left panels) reflect to what extent organisms at a certain depth participates in DVM, the plots of backscatter difference (right panels) suggest net backscatter transfer.

