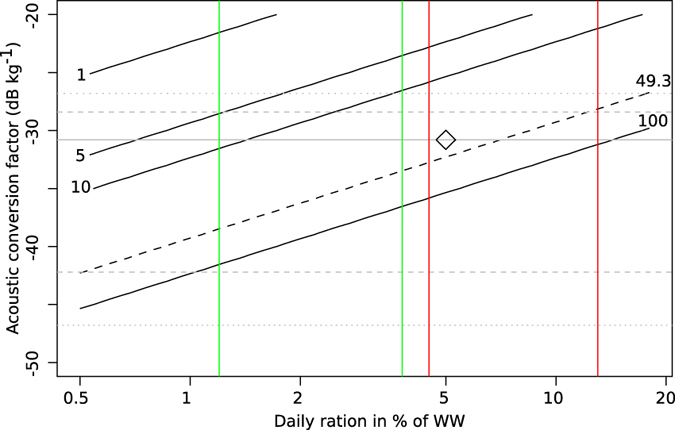
Figure 6. Contour plot of estimated carbon flux in mg C m−2 d−1 (black lines) as a function of acoustic conversion factor and ingestion, for an acoustic transport of 1000 m2 nmi−2.

The sensitivity model assumes that all ingestion occurs in the epipelagic, that half the ingested carbon is transported to mesopelagic depths, and that the carbon constitutes 5% of the ingested wet weight. The black unbroken diagonal lines are contour lines of estimated carbon flux, delineating flux levels of 1, 5, 10 and 100 mg C m−2 d−1. The black diagonal dashed line is the contour line of 49.3 mg C m−2 d−1, corresponding to the global average of gravitational flux out of the epipelagic37. Horisontal gray dotted lines are maximum and minimum acoustic conversion values from literature as reported in Irigoien et al. 20145, dashed lines are 25 and 75 percentiles, and the grey unbroken line is the median value, all from from Irigoien et al. 2014. Green lines indicate range of daily rations reported for myctophids from temperate and subtropical regions48 (range 1.2–3.8% of dry body weight, for simplicity we assume that WW to DW ratio is equal in myctophids and prey). Red lines indicate daily rations reported for subtropical and tropical species48,49 (range 4.5–13% of dry body weight). Using the median acoustic conversion factor from5, and a daily ration of 5% of WW, modelled carbon flux would be ~34.9 mg C m−2 d−1 (black diamond).
