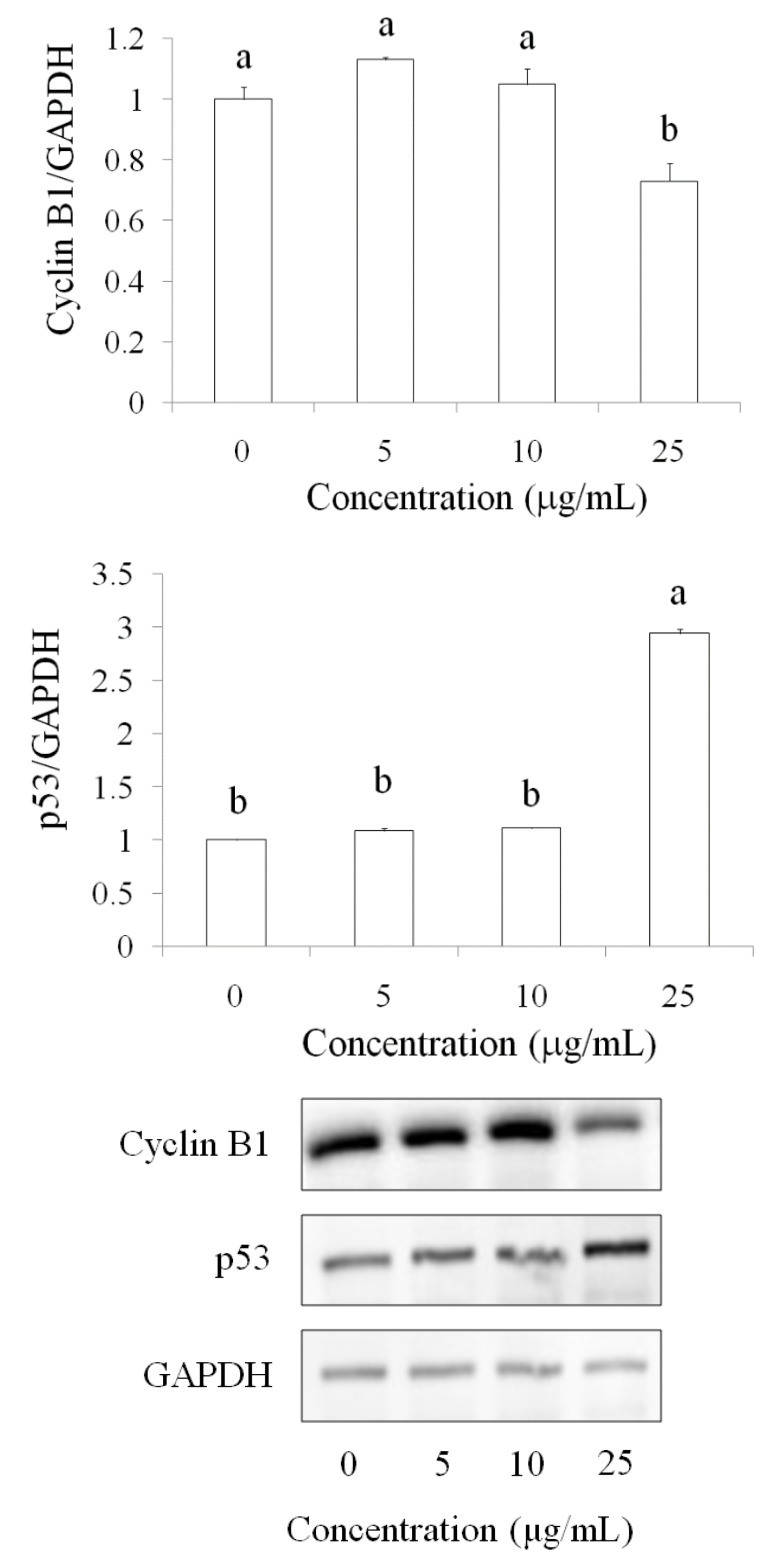
Figure 4.
Regulation of cyclin B1 and p53 after pardaxin treatmentfor 24 h in SCC-4 cells. Cyclin B1 and p53 protein levels were detected using the Western blot technique. Data are presented as the mean ± SD (n = 3). Significant differencesare shown using different letters between a and b (p < 0.05).

