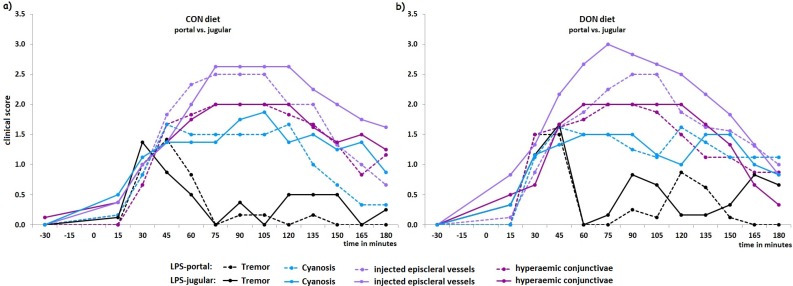
Figure 2.
LPS caused a sequential series of four key symptoms and the kinetic of those individual clinical signs is depicted in the two upper graphs for each dietary treatment. (a) showing CON-fed and (b) DON-fed groups. Tremor reached its highest level already between 30 and 45 min while the other symptoms showed there maximum degree between 75 and 105 min. Thereafter, from 120 min onwards, symptoms declined slowly to the base level. Data represent LSmeans (PSEMTremor ± 0.07, PSEMinjected episcleral vessels/cyanosis ± 0.15, PSEMhyperaemic conjunctivae ± 0.11) and statistical main effects were distributed as follows: cyanosis pgroup < 0.001, ptime < 0.001, pgroup × time < 0.01, tremor/hyperaemic conjunctivae/injected episcleral vessels pgroup < 0.001, ptime < 0.001, pgroup × time < 0.001. The cumulative clinical score (CCS) for each point in time is presented in (c) and the statistical difference (p-value) between jugular and portal infusion within each feeding group is provided. Data represent LSmeans and statistical main effects were distributed as follows: pgroup < 0.001, ptime < 0.001, pgroup × time < 0.001.
| c) | Time in Minutes | ||||||||||||
| −30 | 15 | 30 | 45 | 60 | 75 | 90 | 105 | 120 | 135 | 150 | 165 | 180 | |
| CON_CONjug.-LPSpor. | 0.7 | 1.9 | 5.7 | 8.1 | 7.9 | 7.7 | 8.3 | 7.6 | 7.1 | 6.0 | 5.4 | 4.9 | 3.7 |
| CON_LPSjug.-CONpor. | 1.4 | 2.4 | 7.3 | 8.4 | 8.6 | 8.1 | 8.6 | 9.8 | 9.8 | 8.6 | 8.3 | 7.8 | 8.6 |
| p-values | 0.62 | 0.69 | 0.25 | 0.82 | 0.56 | 0.76 | 0.80 | 0.10 | 0.05 | 0.05 | 0.04 | 0.03 | <0.001 |
| DON_CONjug.-LPSpor. | 0.9 | 1.7 | 8.4 | 10.1 | 8.6 | 7.9 | 7.4 | 7.0 | 9.1 | 7.3 | 6.8 | 6.2 | 7.3 |
| DON_LPSjug.-CONpor. | 1.0 | 4.7 | 8.0 | 9.5 | 9.5 | 8.8 | 9.3 | 8.8 | 8.3 | 8.5 | 7.2 | 7.0 | 4.7 |
| p-values | 0.92 | 0.04 | 0.77 | 0.65 | 0.50 | 0.50 | 0.18 | 0.20 | 0.58 | 0.40 | 0.79 | 0.59 | 0.07 |

