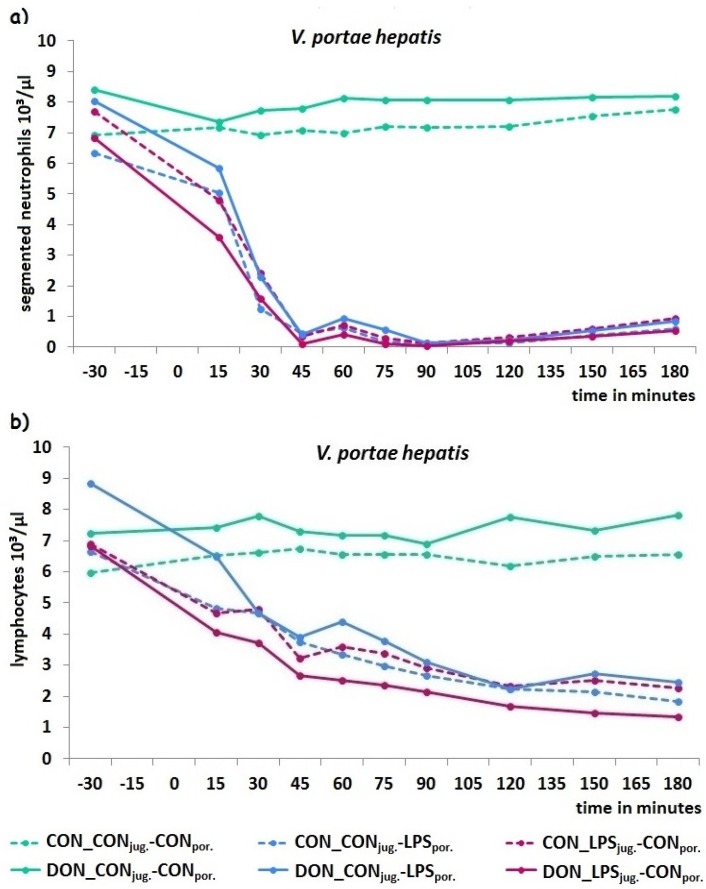
Figure 4.
Kinetics of segmented neutrophil (a) and lymphocyte (b) counts in all experimental groups, with portal data exemplary for all sampling sites. LPS caused a severe neutrophil decrease starting at 15 min p.i.. Data represent LSmeans (SEM ± 0.3) and statistical main effects were distributed as followed: pgroup < 0.001, psampling site = 0.03, ptime < 0.001, pgroup ×sampling site × time < 0.001. LPS caused a more slowly decrease in lymphocytes, also starting at 15 min p.i.. Data represent LSmeans (SEM ± 0.3) and statistical main effects were distributed as followed: pgroup < 0.001, psampling site < 0.001, ptime < 0.001, pgroup × sampling site × time < 0.001.

