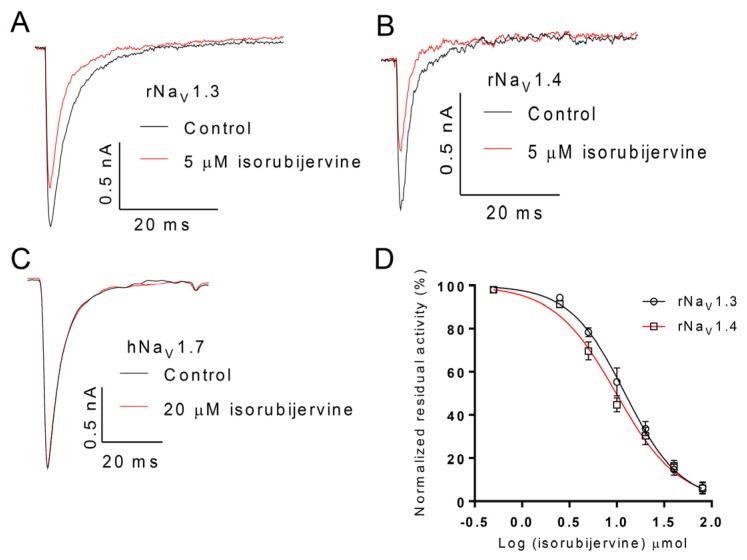
Figure 4.
Effect of isorubijervine on rNaV1.3, rNaV1.4 and hNaV1.7 channels expressed in HEK293t cells. Control currents are shown in black, and the inhibition of rNaV1.3 (A); rNaV1.4 (B) and hNaV1.7 (C) by the indicated concentrations of isorubijervine are shown in red; (D) concentration-response curves for the inhibition of rNaV1.3, and rNaV1.4 channels by isorubijervine (n = 4).

