Figure 2.
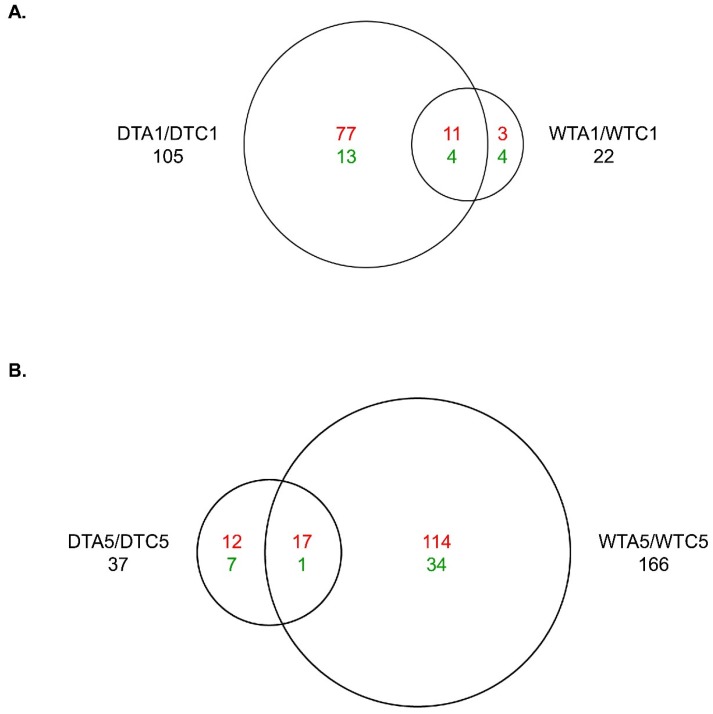
Treatment-related expression changes from aflatoxin B1 (AFB1) occurs predominately in DTA1 and WTA5. (A) A1 versus C1 in DT and WT. (B) A5 versus C5 in DT and WT. Each diagram shows the number of shared and unique genes with significant differential expression (DE) (q-value ≤ 0.05) and |log2FC| ≥ 1.0. Direction of DE (red, above = up-regulated, and green, below = down-regulated) is shown. Domesticated turkey (DT), wild turkey (WT), control 1 day (C1), control 5 days (C5), aflatoxin B1 (AFB1), aflatoxin B1 1 day (A1), aflatoxin B1 5 days (A5), log2 fold change (log2FC).

