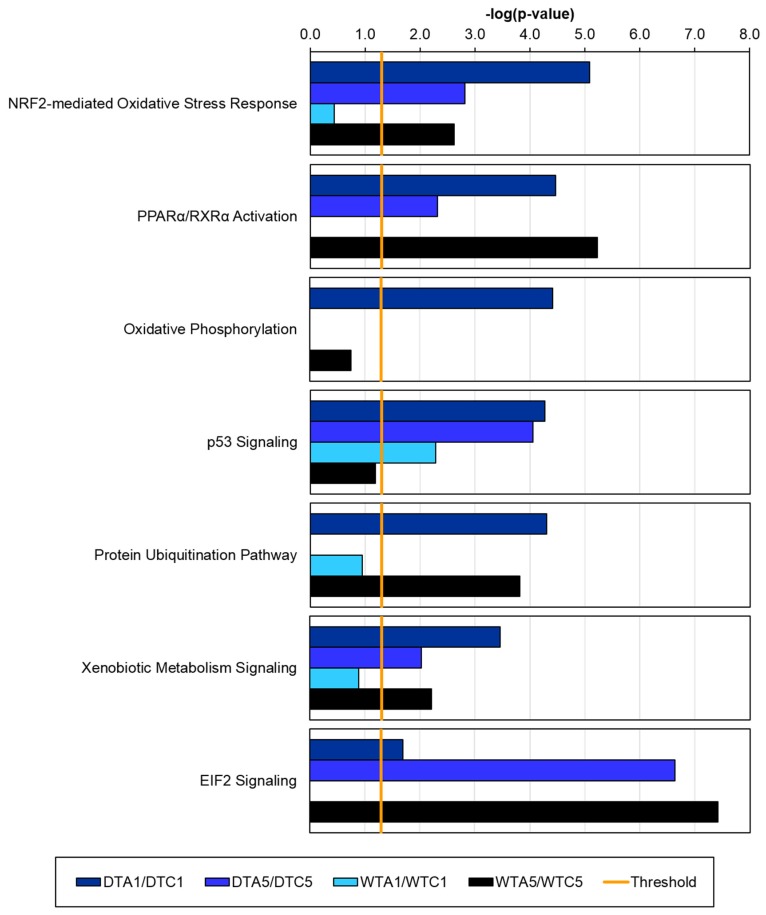
Figure 5.
Significance of pathway associations vary in AFB versus CNTL comparisons. In each pair-wise comparison, Ingenuity Pathway Analysis (IPA) assigned p-values to canonical pathways based on differential expression (DE). Bar plot provides 6 example pathways with variable significance between the DTA1/DTC1 (dark blue), DTA5/DTC5 (bright blue), WTA1/WTC1 (light blue), and WTA5/WTC5 (black) comparisons. Pathway associations must have a -log(p-value) > 1.3 (threshold, vertical yellow line) to be considered significant. Domesticated turkey (DT), wild turkey (WT), control (CNTL), control 1 day (C1), control 5 days (C5), aflatoxin B1 (AFB), aflatoxin B1 1 day (A1), aflatoxin B1 5 days (A5).

