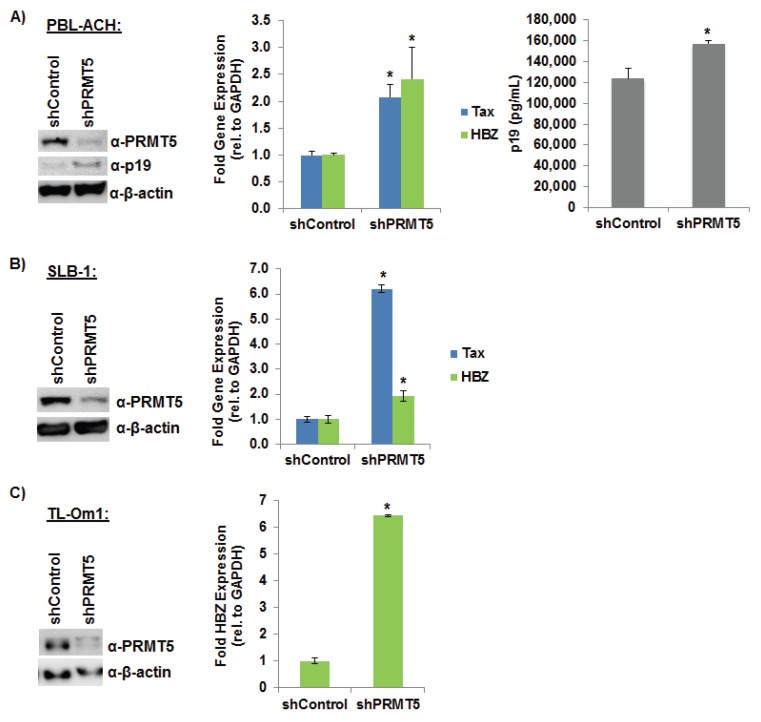
Figure 3.
Loss of endogenous PRMT5 increased HTLV-1 gene expression. (A) PBL-ACH cells (HTLV-1-transformed) were infected with a pool of five different lentiviral vectors directed against PRMT5, or control shRNAs. The cells were selected for 7 days using puromycin. Immunoblot analysis was performed to compare the levels of PRMT5, p19 (Gag), and β-actin (loading control) in each condition (left panel). Quantitative RT-PCR (middle panel) for Tax, HBZ, and GAPDH was performed on mRNA isolated from shControl and shPRMT5 cells. Transcript levels were determined using the ΔΔCt method and normalized to relative GAPDH levels. Levels of Tax and HBZ relative to GAPDH in shControl cells were set to 1. Data are presented in histogram form with means and standard deviations from triplicate experiments. HTLV-1 gene expression was quantified by the detection of the p19 Gag protein in the culture supernatant using ELISA (right panel); (B) SLB-1 cells (HTLV-1-transformed) were infected with a pool of five different lentiviral vectors directed against PRMT5 or control shRNAs. The cells were selected for 7 days using puromycin. Immunoblot analysis was performed to compare the levels of PRMT5 and β-actin protein (loading control) in each condition (left panel). Quantitative RT-PCR for Tax, HBZ, and GAPDH was performed on mRNA isolated from shControl and shPRMT5 cells (right panel). Transcript levels were determined using the ΔΔCt method and normalized to relative GAPDH levels. Data are presented in histogram form with means and standard deviations from triplicate experiments. Levels of Tax and HBZ relative to GAPDH in shControl cells were set to 1; (C) TL-Om1 cells (ATL-derived, Tax-negative) were infected with a pool of five different lentiviral vectors directed against PRMT5, or control shRNAs. The cells were selected for 7 days using puromycin. Immunoblot analysis was performed to compare the levels of PRMT5 and β-actin protein (loading control) in each condition (left panel). Quantitative RT-PCR for HBZ and GAPDH was performed on mRNA isolated from shControl and shPRMT5 cells (right panel). HBZ transcript level was determined using the ΔΔCt method and normalized to relative GAPDH levels. Data are presented in histogram form with means and standard deviations from triplicate experiments. Levels of HBZ relative to GAPDH in shControl cells were set to 1. Student’s t test was performed to determine significant differences in viral transcript levels between shControl and shPRMT5 cells; p < 0.05 (*).

