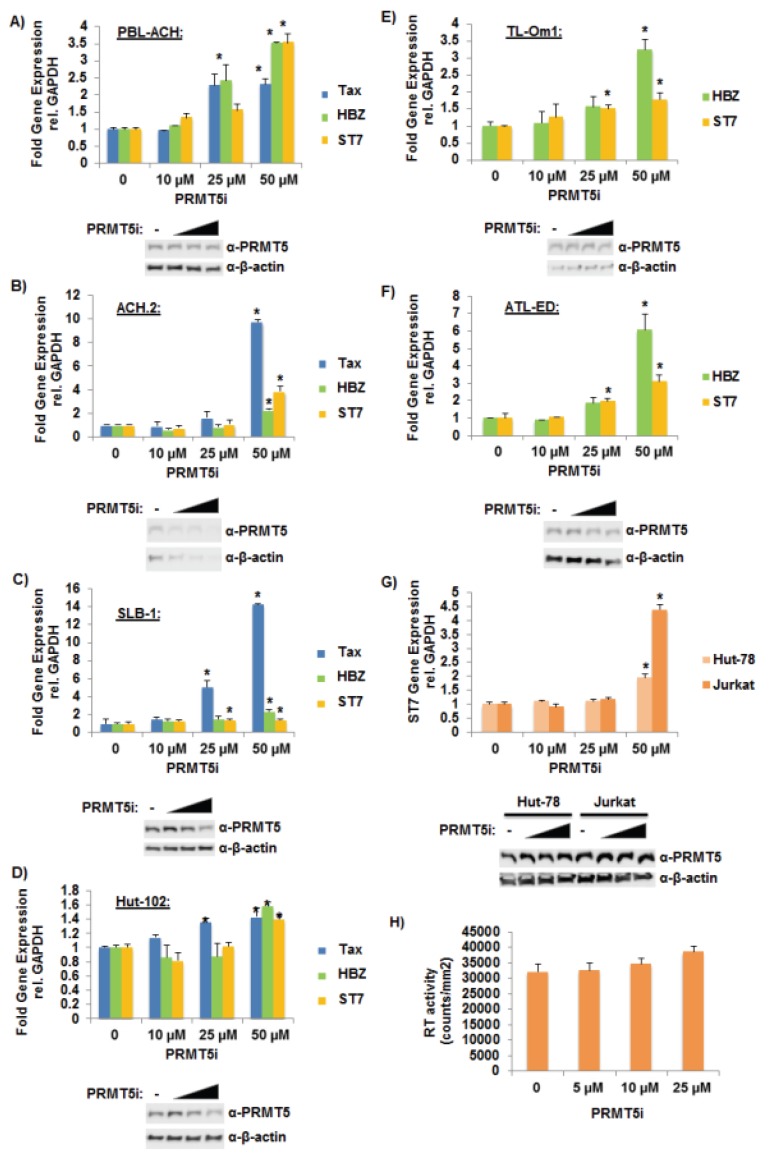
Figure 4.
Selective inhibition of PRMT5 enhanced HTLV-1 gene expression. (A) PBL-ACH, (B) ACH.2, (C) SLB-1, (D) Hut-102, (E) TL-Om1, (F) ATL-ED, (G) Jurkat, and Hut-78 cells were treated with titrating amounts of PRMT5i for 48 h. (PBL-ACH, ACH.2, SLB-1, and Hut-102 cells are HTLV-1-tranformed lines; TL-Om1 and ATL-ED are ATL-derived Tax-negative lines; Jurkat and Hut-78 are HTLV-1 negative lines.) Cells were collected by slow centrifugation at 800 xg for 5 min. Quantitative RT-PCR for Tax (where indicated), HBZ (where indicated), ST7, and GAPDH was performed on mRNA isolated from cells in each condition. Transcript level was determined using the ΔΔCt method and normalized to relative GAPDH levels. Data are presented in histogram form with means and standard deviations from duplicate experiments; vehicle-treated cells were set to 1 (upper panel). Student’s t test was performed to determine significant differences in viral transcript levels between vehicle and inhibitor treated cells; p < 0.05 (*). Inhibitor-treated cells were also subjected to immunoblot analysis to compare the levels of endogenous PRMT5 expression. β-actin expression was used as a loading control (lower panel); (H) ACH-2 cells were treated with titrating amounts of PRMT5i for 48 h. Average reverse transcriptase (RT) activity of triplicate experiments is depicted.

