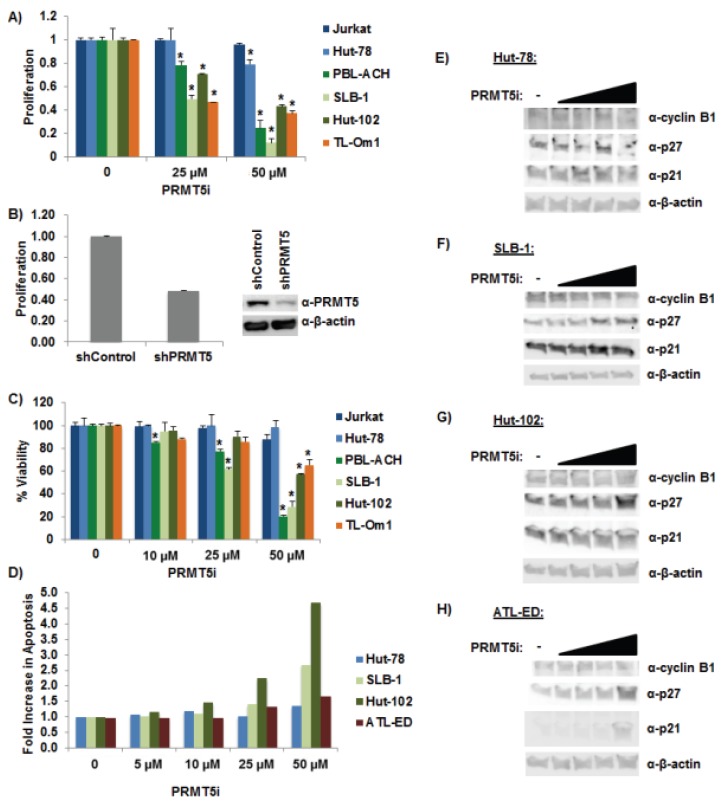
Figure 5.
Selective inhibition of PRMT5 decreased cell proliferation and viability. (A) Cellular proliferation was measured using an MTS cellular proliferation assay in Jurkat, Hut-78, PBL-ACH, SLB-1, Hut-102, and TL-Om1 cell lines after 48 h of PRMT5i treatment. (Jurkat and Hut-78 are HTLV-1 negative lines; PBL-ACH, SLB-1, and Hut-102 cells are HTLV-1-tranformed lines; TL-Om1 is an ATL-derived Tax-negative line.) Data are presented in histogram form with mean and standard deviations from duplicate experiments. Vehicle treatment for each cell type was set at 1. Student’s t test was performed to determine significant differences in cellular proliferation between vehicle and inhibitor-treated cells; p < 0.05 (*); (B) SLB-1 cells were infected with a pool of five different lentiviral vectors directed against PRMT5 or control shRNAs. The cells were selected for 7 days using puromycin. Immunoblot analysis was performed to compare the levels of PRMT5 and β-actin protein (loading control) in each condition (right panel). Cellular proliferation was measured using an MTS cellular proliferation assay (left panel); (C) Cellular viability was measured using Trypan blue exclusion method in Jurkat, Hut-78, PBL-ACH, SLB-1, Hut-102, and TL-Om1 after 48 h of PRMT5i treatment. Data are presented in histogram form with means and standard deviations from duplicate experiments. Vehicle treatment for each cell type was set at 100% viability. Student’s t test was performed to determine significant differences in cellular viability between vehicle and inhibitor treated cells; p < 0.05 (*); (D) Cellular apoptosis was measured using a FITC Annexin V Apoptosis Detection Kit as described in the Materials and Methods. The percentage of cells undergoing apoptosis in vehicle (DMSO) treated cells was set at 1. The fold increase in apoptosis was measured in Hut-78, SLB-1, Hut-102, and ATL-ED cells in response to titrating amounts of PRMT5i after 24 h of treatment; (ATL-ED is an ATL-derived Tax-negative line.) (E–H) Immunoblot analysis was performed in Hut-78, SLB-1, Hut-102, and ATL-ED cells after 24 h of PRMT5i treatment to compare the levels of p21, p27, cyclin B1, and β-actin expression (loading control) in each condition (right panel).

