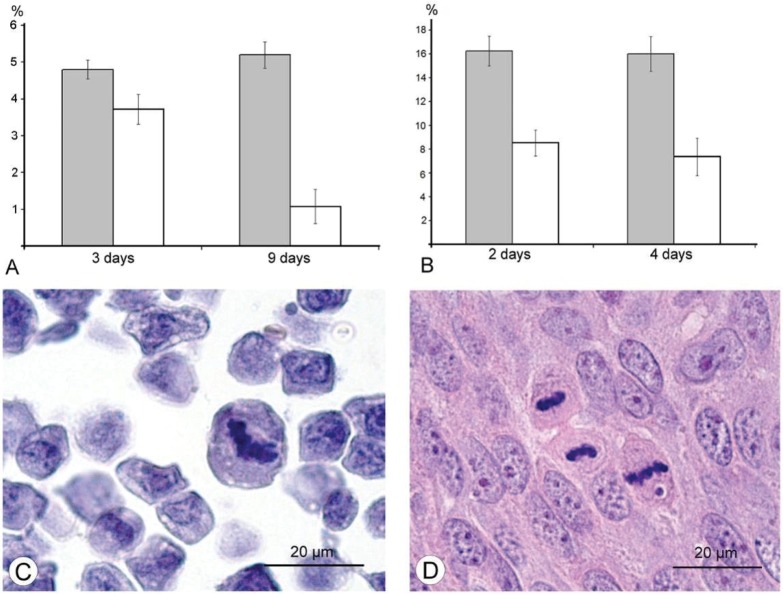
Figure 6.
Decrease in number of mitoses in murine Ehrlich ascitic carcinoma (A) and human A431 carcinoma xenografts (B) after injection of the L-IVP strain. The period after virus injection is shown on the X-axis; the percent of mitotic cells in shown on the Y-axis. The white columns correspond to the L-IVP treated mice, the grey columns correspond to saline treated. Counting was performed on paraffin sections at 400-fold magnification. Photos (C) and (D) show mitotic cells in paraffin section of Ehrlich ascitic and A431 carcinomas, respectively.

