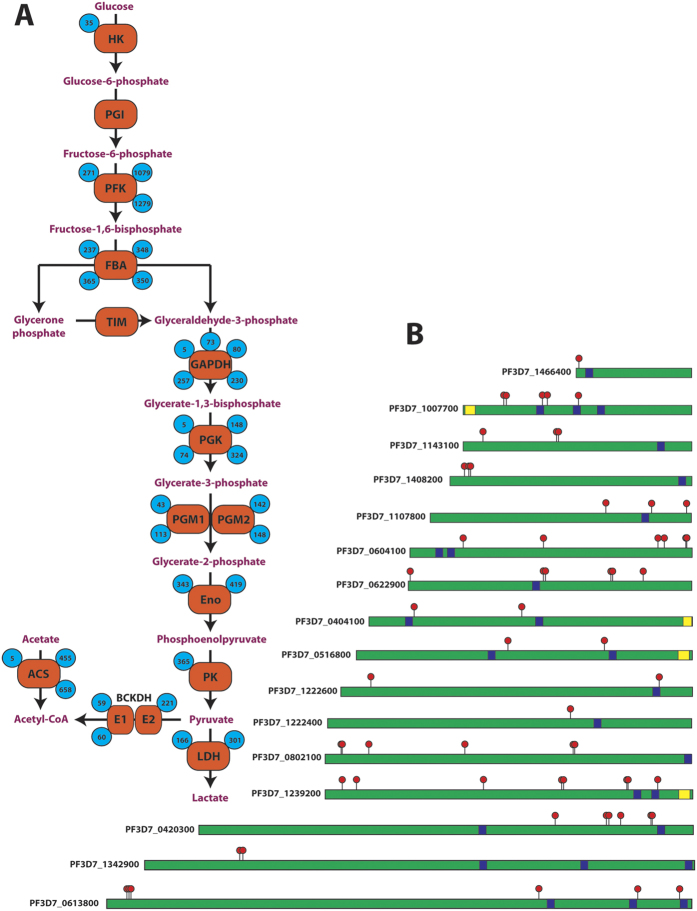
Figure 2.
(A) Acetylation of glycolytic and acetyl-CoA biosynthetic enzymes. Numbers inside blue circles indicate the position of the acetyl-lysine site, enzymes represented are hexokinase (HK), phosphoglucose isomerase (PGI), phosphofructokinase (PFK), fructose bisphosphate aldolase (FBA), triose phosphate isomerase (TIM), glyceraldehyde-3-phosphate dehydrogenase (GAPDH), phosphoglycerate kinase (PGK), phosphoglycerate mutase 1/2 (PGM1/2), enolase (Eno), pyruvate kinase 1 (PK), lactate dehydrogenase (LDH), branched-chain keto-acid dehydrogenase subunit E1/E2 (BCKDH E1/E2), acetyl-CoA synthetase (ACS). (B) Distribution of acetyl-lysine on ApiAP2 DNA-binding proteins. Red flags indicate acetylated lysines, blue boxes represent AP2 DNA-binding domains and yellow boxes represent ACDC domains (AP2-coincident domain mostly at the C-terminus). The non-represented ApiAP2 proteins are not acetylated.

