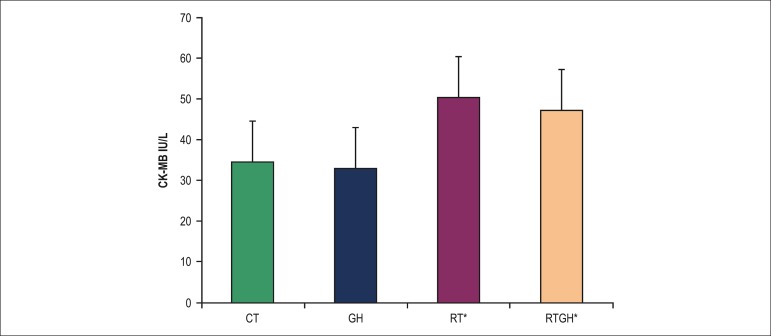
Figure 3.
Measurement of creatine kinase muscle-brain fraction (CK-MB) by use of biochemical analysis, expressed as mean ± standard deviation. CT: Control group; GH: Growth hormone group; RT: Resistance training group; RTGH: Resistance training + growth hormone group. *p < 0.05 (statistically significant difference): CT versus RT; p < 0.05 CT versus RTGH; p < 0.05 GH versus RT; p < 0.05 GH versus RTGH.

