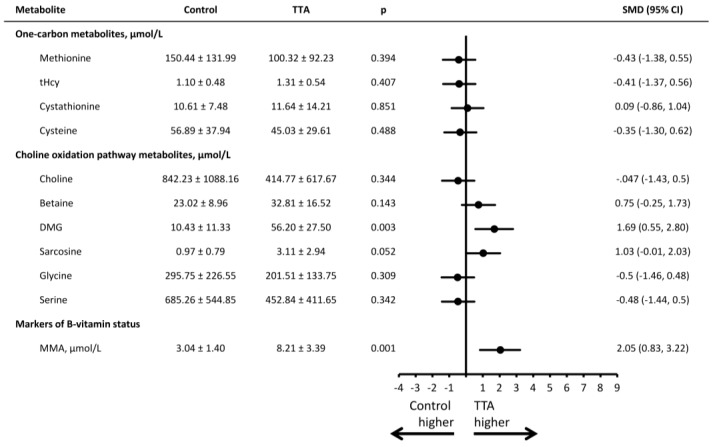
Figure 3.
Urinary concentrations of metabolites in rats receiving a high fat control diet or a high fat diet with additional TTA treatment. Male Wistar rats were treated with a high-fat diet with or without additional TTA treatment, n = 10 in each group. Mean (SD) urinary concentration of the metabolites, as well as the standardized mean difference (95% CI) between the control and the TTA treated animals. DMG indicates dimethylglycine; MMA, methylmalonic acid; SMD, standardized mean difference; tHcy, total homocysteine; TTA, tetradecylthioacetic acid.

