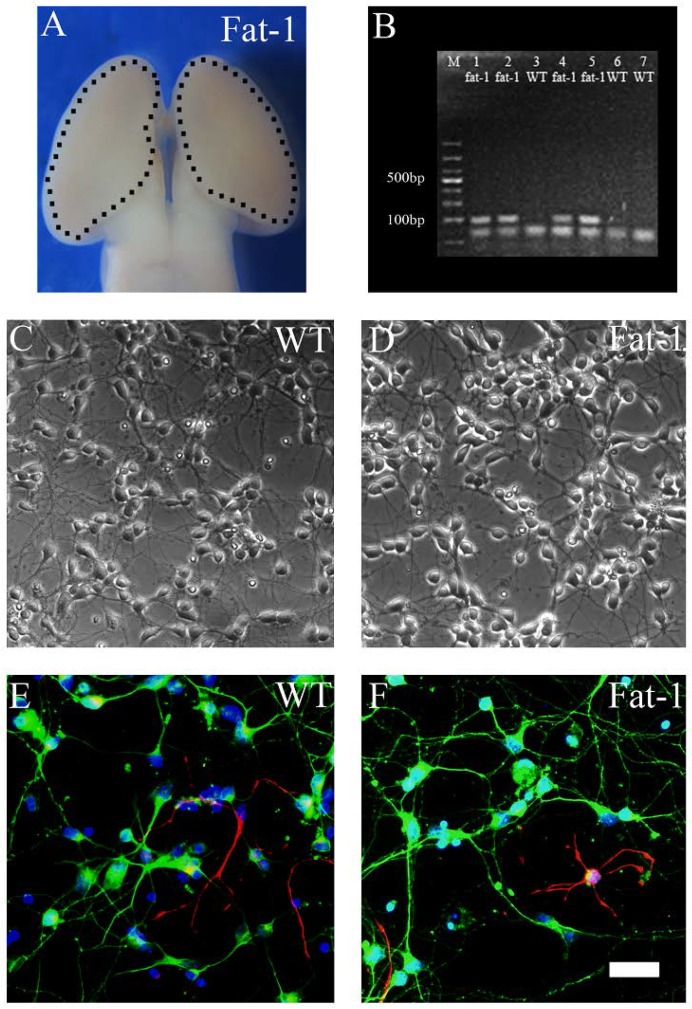
Figure 1.
Identification of primary cultured neurons. Cultures were prepared from the cortex of E16.5 fat-1 and WT embryos and examined at 7 DIV. (A) An image showing the cortical tissue in the embryonic brain; (B) gel electrophoresis of PCR products using primers for fat-1 gene. Wild-type controls (lanes 3, 6 and 7) and positive fat-1 specimens (lanes 1, 2, 4 and 5); (C,D) examples of phase contrast images of cultured primary neurons; and (E,F) images showing immunostainning on WT and fat-1 neurons respectively (Green, β-III tubulin; Red, GFAP; Blue, DAPI). Scale bar: 50 µm.

