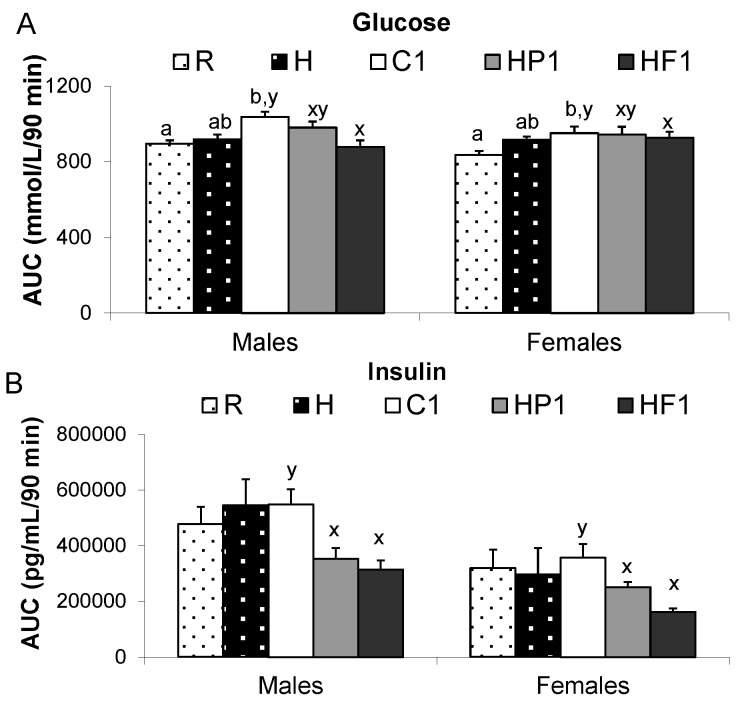
Figure 4.
Area under the curve for glucose (A), insulin (B), amylin (C) and leptin (D) over a 90 min oral glucose tolerance test (OGTT) at 28 weeks. Values are means ± SEM, n = 10 per group except n = 4 for group H. Treatments with different letters are significantly different between diets: superscripts x,y indicate significant difference between C1, HP1, HF1; superscripts a,b indicate significant difference between R, H and C1 (p < 0.05).


