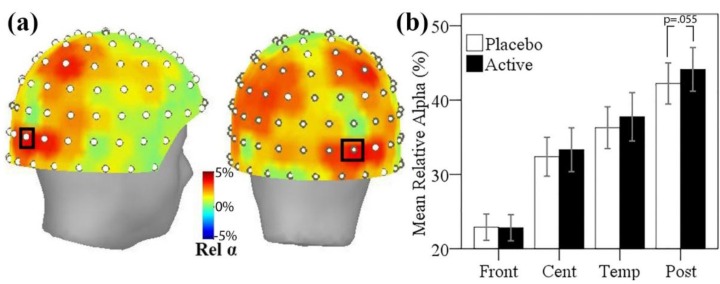
Figure 4.
(a) Topographic maps of mean relative alpha difference between active and placebo visits viewed from the right side and posterior views (positive numbers = greater at active visit). The sensor showing a trend of p < 0.1 is marked with black rectangle; (b) Mean relative alpha power at each treatment visit, averaged across magnetometer sensors within frontal (Front), central (Cent), temporal (Temp), and parieto-occipital (Post) regions. Error bars ± 1 SE.

