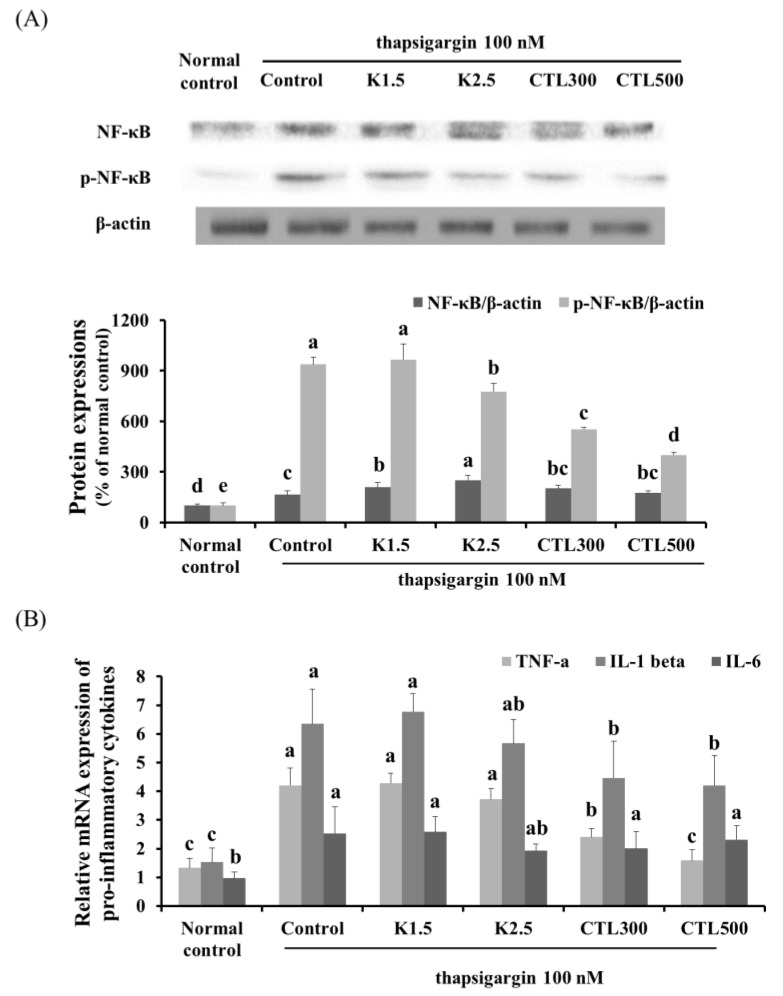
Figure 4.
Effect of CTL and kaempferol on inflammation in thapsigargin-induced HepG2 cells. (A) Representative Western blots for total protein and phosphorylation of NF-κB in thapsigargin-induced HepG2 cells with CT water extract or kaempferol; (B) mRNA expression of pro-inflammatory cytokines (TNF-α, IL-1β and IL-6) in thapsigargin-induced HepG2 cells with CT water extract or kaempferol. The data are expressed as the mean ± SD (n = 3). The different letters show a significant difference at p < 0.05 as determined by Duncan’s multiple-range test.

