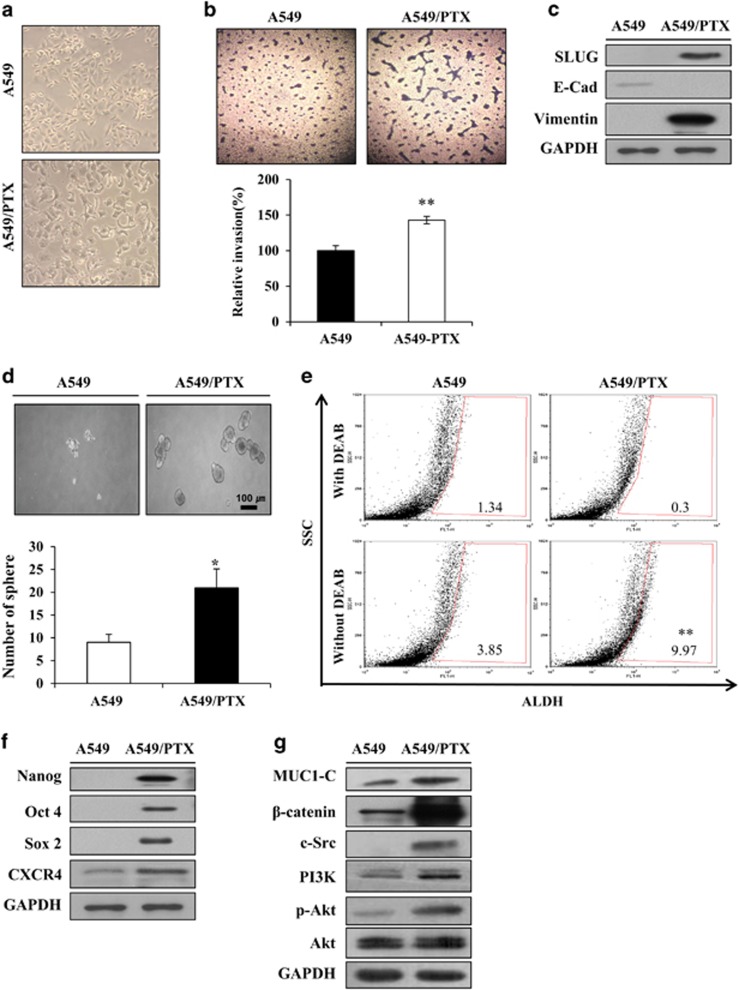
Figure 1.
PTX resistance increases CSCs traits in A549. (a) Morphology of A549/PTX cells. (b) Invasion assay of A549 and A549/PTX cells. Images were captured at a magnification of × 200. Percentage of relative invasion in A549 and A549/PTX cells. (c) Expression level of EMT markers in A549 and A549/PTX cells. (d) Sphere formation in the A549 and A549/PTX cells cultured for 10 days (tight, spherical, non-adherent masses >100 μm in diameter; magnification, × 40). Bar represents 100 microns. Sphere formation efficiency=colonies/input cells × 100%. (e) FACS analysis of ALDH-positive cells in A549 and A549/PTX cells. (f) Expression level of stemness genes and (g) survival factors in A549 and A549/PTX cells. Data are the mean±s.e.m. (n=5) *P<0.05 and **P<0.01.

