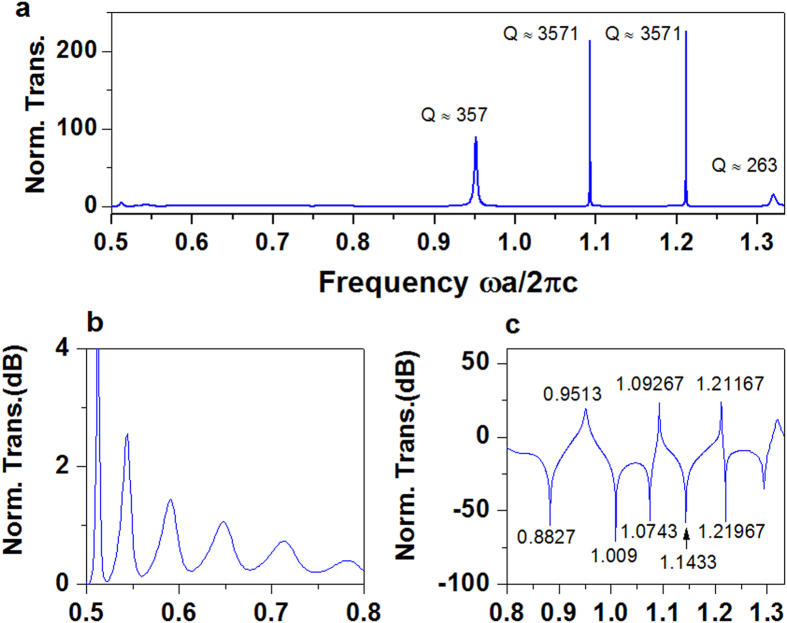
Figure 2. Calculated transmission, illustrating Fano resonances from the designed waveguide system.
(a)Normalized transmission when the TE source is located at the centre of the structure. The peaks are located at frequencies of, from left to right, 0.95130, 1.09267, 1.21167 and 1.32000, respectively. (b,c) Normalized transmission of (a) divided into two sections and re-plotted in a dB scale. In (c) the deep positions (minima) are at 0.88270, 1.00900, 1.07430, 1.14330 and 1.21976, respectively.

