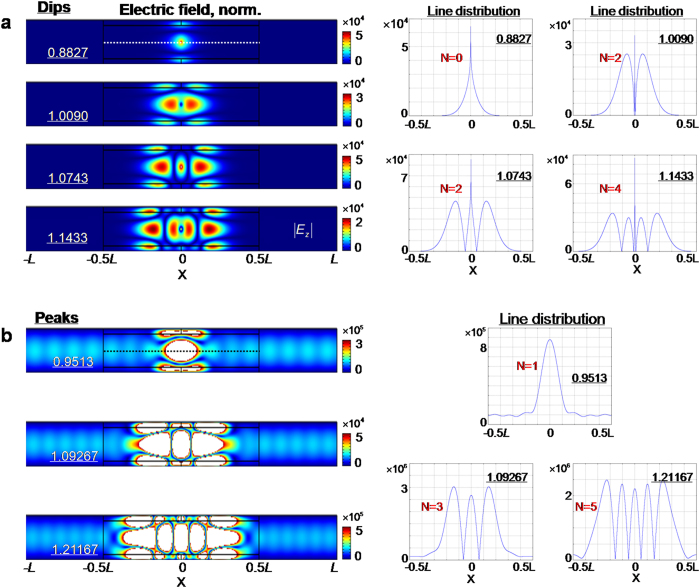
Figure 3. Electric field distributions at resonance dips and peaks.
(a) Resonance dips. The left panel shows the field patterns of electric field density in the waveguide system, at frequencies 0.8827, 1.0090, 1.0743 and 1.1433, respectively. The right panel shows the line distributions of electric field density along the middle line (shown by the dashed white line in left panel), at the four frequencies. (b) Resonance peaks. As in (a) the left panel shows the field patterns, while the right presents the corresponding line distributions.

