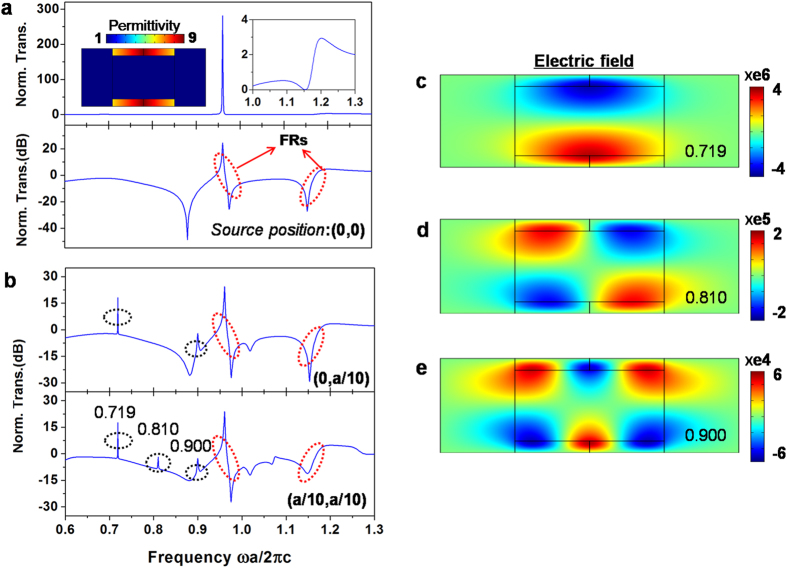
Figure 4. The robust features of the designed structure for achieving Fano resonance.
(a) Calculated transmission when a TE source is located at centre (at position (0,0)) in the waveguide with GIMs whose refractive index ranges from 2.5 to 3. The upper panel shows the normalized transmission, and the inset shows the structure under consideration as well as the index distribution. The lower panel presents the same results in dB form, illustrating clearly the characteristic of all resonances in the spectrum. Two dashed red circles indicate the two Fano resonances that emerge. (b) Calculated transmission when the TE source deviates from the centre. The upper panel is for a source at position (0, a/10), while the lower panel is for a source at position (a/10, a/10). The dashed black circles indicate several peaks in the spectrum, originating from the resonances of mode M2. (c–e) Electric field distributions corresponding to resonance frequencies at 0.719, 0.810 and 0.900, respectively. Here the width of GIMs and the length of the whole structure are d = a/10 and L = 1.25a.

