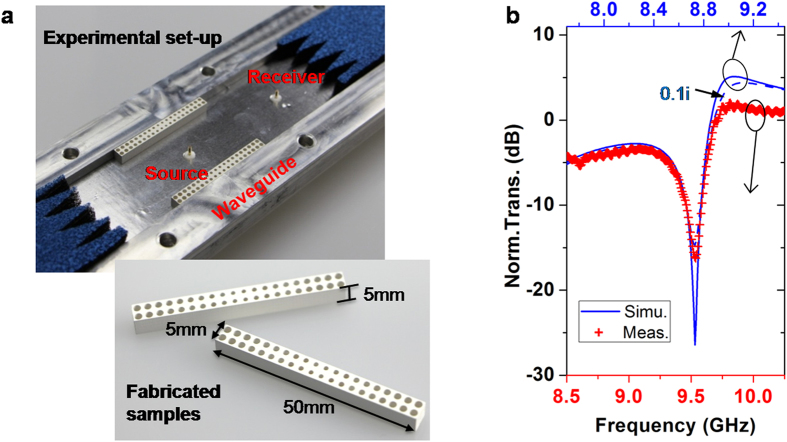
Figure 5. Experimental verification of Fano resonances.
(a) The experimental set-up and fabricated samples. The width and height of the waveguide are a = 40 mm and h = 5 mm, respectively, and the length, width and height of samples are L = 50 mm, d = 5 mm and h = 5 mm, respectively. The source is positioned at the centre, and the receiver is located out of the designed region, 25 mm from its outer boundary. (b) The normalized transmissions of experimental measure (red crosses) and simulated analysis (blue curves). In the simulations, the two slabs of GIMs are replaced by designed samples, that is, by two dielectric substrates with different holes. The blue solid curve is for substrate without loss, while the blue dashed one is for substrate of  .
.

