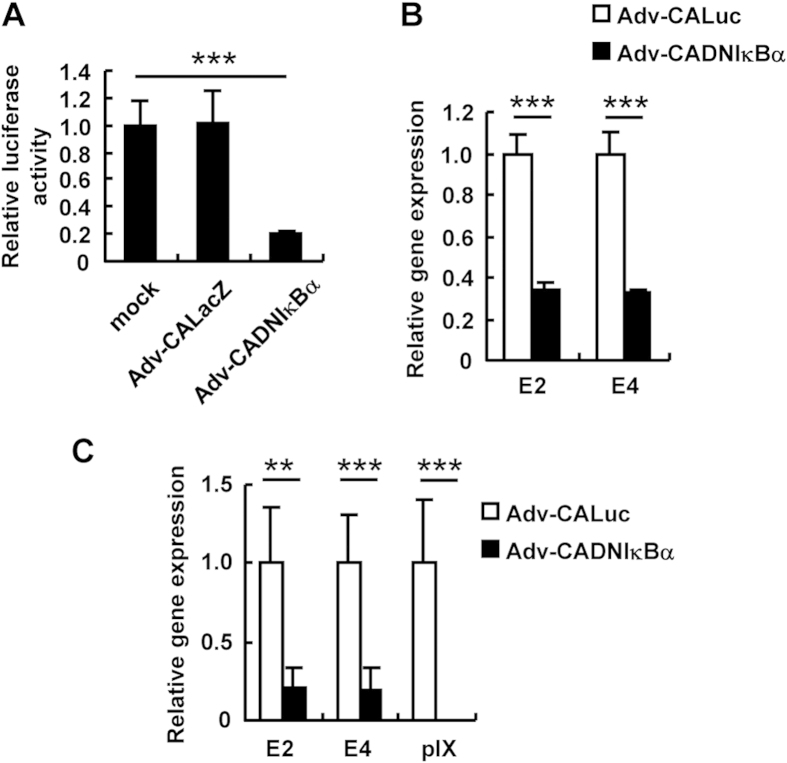
Figure 7. Suppression of Ad early gene expression by expression of a dominant-negative IκBα gene.
(A) HeLa cells were transfected with pNF-κB-Luc, followed by transduction with Adv-CALuc or Adv-CADNIκBα at an MOI of 5. After 48-h incubation, luciferase activity was determined. The data show FLuc activity normalized by RLuc activity. (B) HeLa cells were transduced with Adv-CALuc or Adv-CADNIκBα at an MOI of 5. After 48-h incubation, the E2 and E4 mRNA levels in the cells were determined by quantitative RT-PCR. These data (A,B) are expressed as the means ± S.D. (n = 4). (C) C57BL/6 mice were intravenously administered 109 IFU of Adv-CALuc or Adv-CADNIκBα. Forty-eight hours after the administration, the E2, E4, and pIX mRNA levels in the mouse liver were determined by quantitative RT-PCR. The data are expressed as the means ± S.E. (n = 5–6). **p < 0.01, ***p < 0.001.

