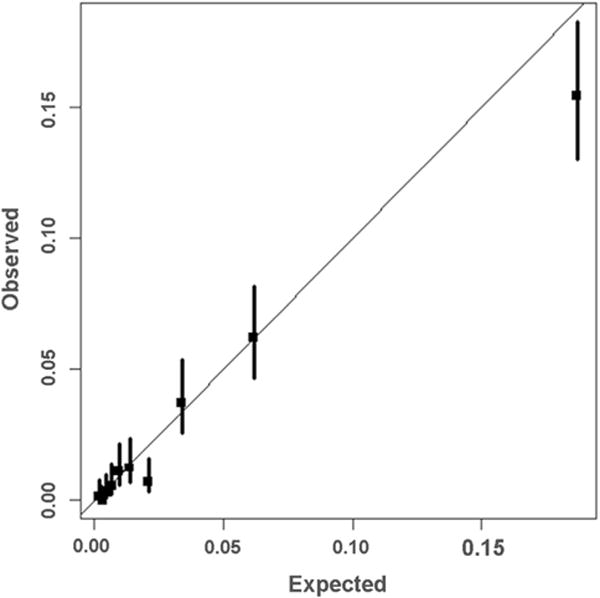
Fig 1.

Model calibration in the validation sample. This figure displays observed vs predicted mortality estimates (and the 95% confidence interval) for 10 equally sized groups of patients ordered from lowest to highest risk in the validation sample. Perfect calibration is represented by the 45-degree line.
