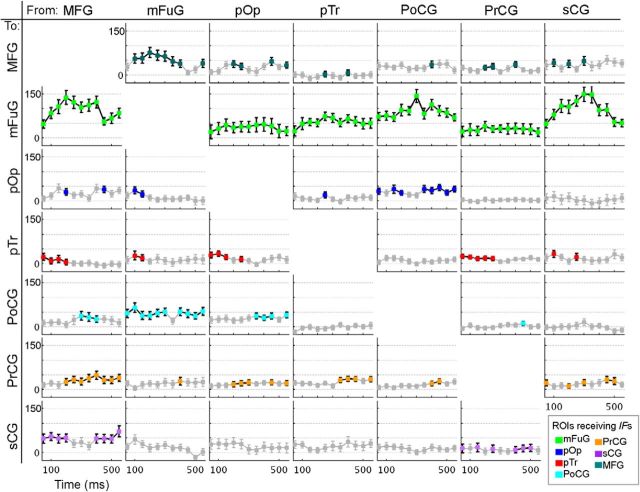
Figure 5.
Information flows (IFs) aligned to stimulus onset. Percentage changes of IFs derived from SdDTF compared with baseline during time windows following stimulus onset. Markers in gray represent values that did not achieve significance (Wilcoxon signed rank, p = 0.01, FDR-corrected for multiple comparisons). Markers (not in gray) are shown in the color corresponding to the region receiving the flow (see Fig. 4). Horizontal axis labels are the first point of each 100 ms window. The plot in ith row, jth column represents IFs from the jth region to the ith region.

