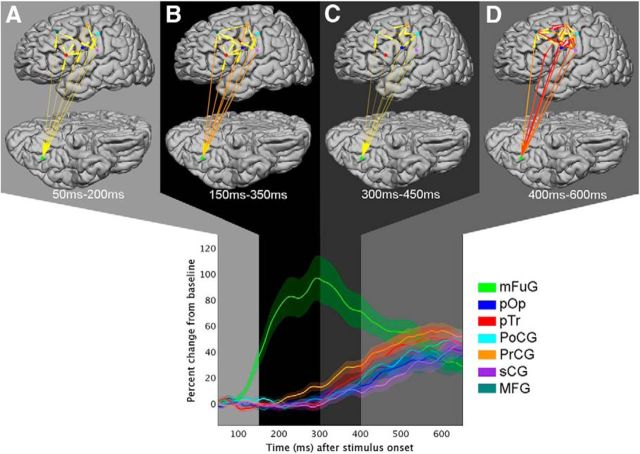
Figure 7.
Stimulus-onset aligned clusters. Stimulus-aligned information flows (IFs) were analyzed with k-means clustering to identify network-level transitions. Each cluster is shown in a different shade of gray. Top, Arrows indicate time integrals of IFs for the four cluster timeframes shown. Color and width of arrows are proportional to the magnitude of the normalized integrated information. State A exists from 50–200 ms, State B from 150–350 ms, State C from 300–450 ms, and State D from 400–600 ms. Bottom, BGA time traces are overlaid on top of shaded clusters (periods of overlap are not depicted). The clusters were derived from all IFs values, not just those that achieved significance. This figure should be viewed along with Figure 8, which shows articulation onset aligned clusters. Similar IFs and regional broadband gamma activity can be seen in both State D time-locked to stimulus onset and State E (in Fig. 8) that is time-locked to articulation onset.

