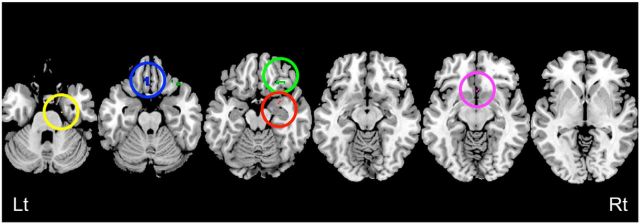
Figure 2.
Brain areas specific to mother–daughter relationships. Brain map representing voxels that overlap between three maps presented in Figure 1 to illustrate a specific positive association in mother–daughter pairs. Red circle represents amygdala. Blue circle represents the gyrus rectus. Green circle represents the OFC. Pink circle represents the ACC. Yellow circle represents the parahippocampus gyrus. Although the extent of brain regions are smaller compared with Figure 1 (because of the conservative nature of conjoint analysis), we still observed significant voxels in the same brain areas. Lt, Left; Rt, right. For all analyses, the statistical threshold is set at p = 0.05 corrected.

