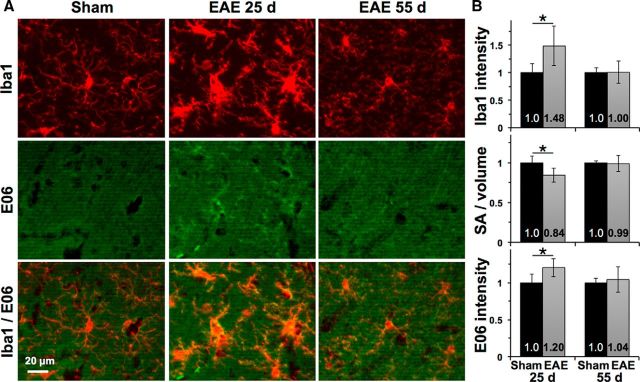
Figure 5.
Microglial activation and oxidation in EAE hippocampus. A, Iba1-positive microglia developed a hypertrophic morphology in EAE mice at 25 dpi and an intermediate morphology with shorter and less-ramified processes at 55 dpi compared with those from sham-immunized controls. Top, The 25 dpi sham. E06 immunostaining for oxidized phospholipids was increased within and around microglia in EAE at 25 dpi and was attenuated at 55 dpi with residual staining in some microglia. Bottom, Thresholding applied equally to E06 images. B, Segmentation analysis shows increased Iba1 intensity, lower surface area-to-volume ratio, and increased E06 intensity within microglia in EAE at 25 dpi. *p < 0.025 versus sham.

