
Figure 3.
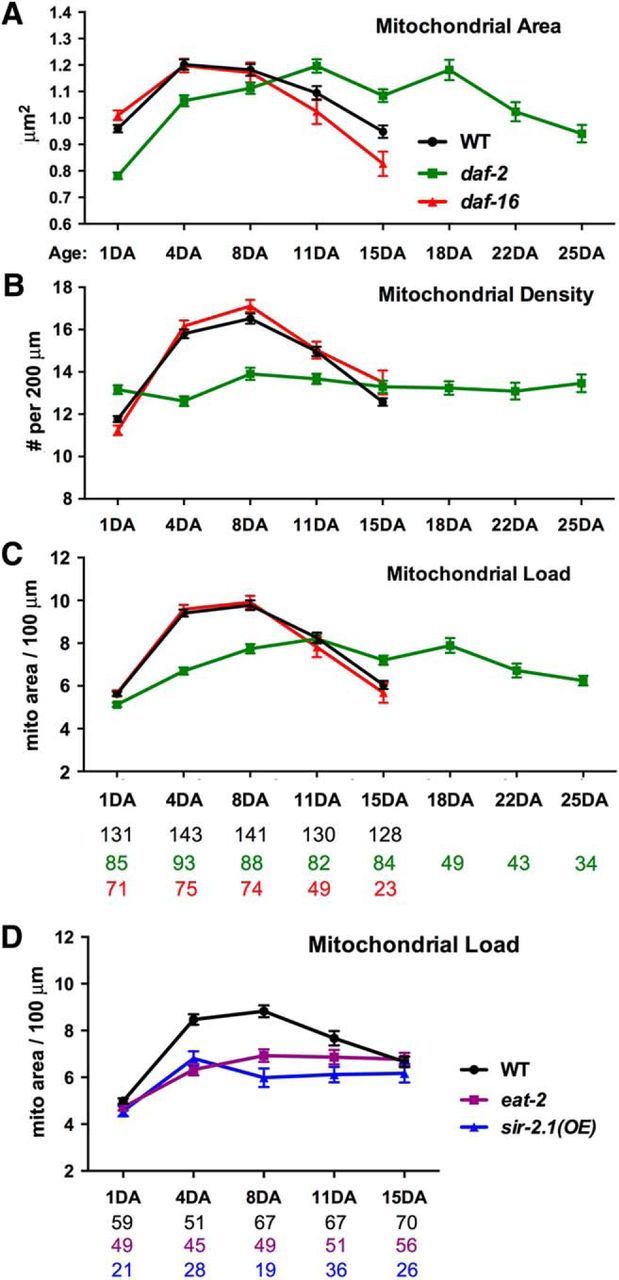
Long-lived mutants show stable mitochondrial load over animal adulthood. A–C, Quantitative analysis of mitochondrial size (A), density (B) and load (C) in distal ALM processes of WT, long-lived daf-2(e1370), and slightly short-lived daf-16(mu86) mutants over animal adulthood. Note that aging-associated triphasic changes in mitochondrial size were delayed in daf-2 mutants (A). daf-2 mutants exhibited relatively constant mitochondrial density (B) and load (C) in ALM distal processes during life: neither rapid incline nor decline was observed. All animals were age-synchronized at the egg stage (Table 2). D, Quantitative analysis of mitochondrial load in distal ALM processes of WT and long-lived eat-2(ad465) and sir-2.1OE animals. Both eat-2 and sir-2.1OE strains maintained a more stable mitochondrial load in the distal ALM processes during the 4DA to 15DA period, neither rapid incline nor decline was observed. Data were pooled from three independent trials. All animals were age synchronized at the L4 stage (due to developmental delay of eat-2). The total number of animals in each group is indicated under bar graphs. Data represent means ± SEM.