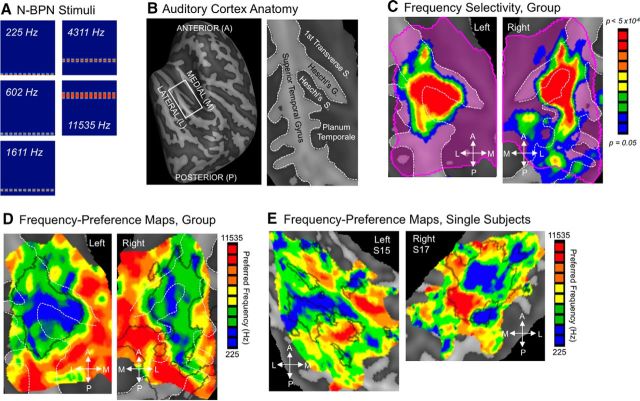
Figure 1.
Frequency selectivity in human auditory cortex. A, N-BPN stimuli are displayed in spectrograms; x-axes span 0 to 3 s, and y-axes span 0 to 16 kHz (linear scale). B, The anatomy of the superior temporal cortex is shown using a reconstruction of a group-averaged cortical surface (left), flattened to display all structures in the same plane (right). The borders of major sulci and gyri are marked with white dashed lines. In all subsequent figures, data are presented in this manner, on flattened cortical surfaces with sulci/gyri outlined in white dashed lines. C, Voxels with statistically different BOLD responses to five frequencies of N-BPN are shown, indicating clear frequency selectivity. Such voxels were present throughout the left and right superior temporal plane (key at right; right hemisphere flipped around the AP axis to match the left). D, Group frequency-preference maps or tonotopic maps are shown, whereby color represents the preferred stimulus frequency (i.e., the frequency with the highest BOLD response), as shown in the key at right. Black outlines mark the outline of the clusters from B. E, Single-subject maps of preferred frequency are displayed for two representative subjects (S15, S17). Black outlines mark regions of significant frequency selectivity for each subject as for group maps in D (p < 0.01).

