
Figure 3.
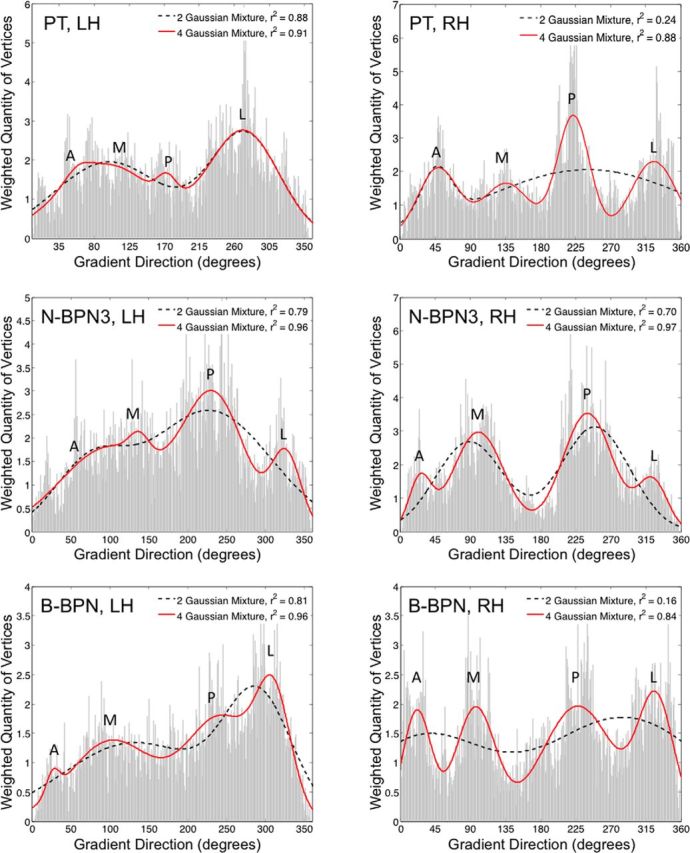
Quantifying tonotopic frequency gradients. For each tonotopic map, the quantity of vertices (i.e., points on the map) exhibiting a given tonotopic gradient direction are displayed. Distributions are given for left- and right-hemisphere maps in left and right columns, respectively, and for PT, N-BPN3, and B-BPN maps in the top, middle, and bottom rows, respectively. Functions containing mixtures of two (black dashed lines) or four (red lines) Gaussians/peaks were fitted to each distribution to assess overall patterns in gradient direction in each tonotopic map. The amount of variance accounted for by these two- and four-Gaussian mixtures is displayed in insets (r2 value). Additional goodness-of-fit measures were compatible with r2 values; both the AIC and BIC were less for four- than two-Gaussian models, indicating a better fit (two-Gaussian model AIC, −2.84, −3.12, −2.36; four-Gaussian model AIC, −4.44, −3.41, −4.02; two-Gaussian model BIC, −2.78, −3.06, −2.29, four-Gaussian model BIC, −4.31, −3.28, −3.89 for PT, N-BPN3, B-BPN, respectively). The approximate gradient direction is indicated for each peak: A, anterior; M, medial; P, posterior; L, lateral.