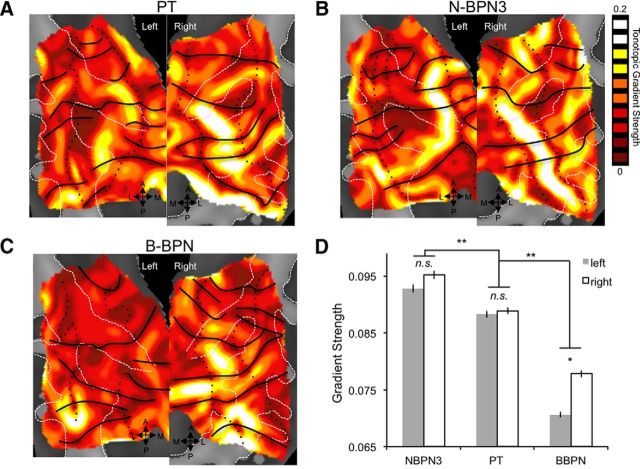
Figure 4.
Strength of tonotopic gradients in human auditory cortex. A–C, Strength of frequency organization is displayed for tonotopic gradients in maps for PT (A), N-BPN (B), and B-BPN stimuli (C). Reversals in frequency organization are marked as in Figure 2B. A region of high gradient strength is located near central Heschl's gyrus and sulcus, and may correspond to A1. D, Average gradient strength is plotted for each of the maps in A–C; error bars reflect the SEM across map voxels. Significant differences between stimulus bandwidths are shown by double asterisks. A significant hemisphere by stimulus bandwidth interaction is marked with a single asterisk.

