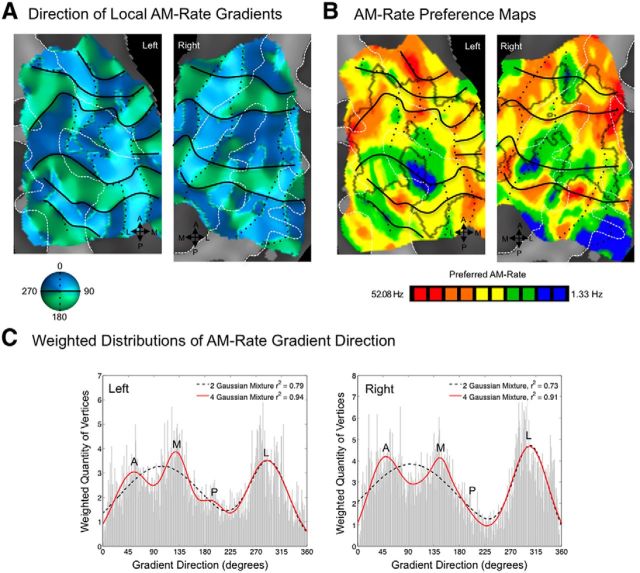
Figure 6.
Topographic organization by preferences for temporal modulation rate in auditory cortex. A, Gradient maps for preferred AM rate are shown, where color indicates the gradient direction moving from low to high AM rates. Black lines mark gradient reversals between 0/360 and 180° (green to blue, respectively), and black dotted lines mark reversals between 90 and 270° (dark to light colors, respectively). B, Group maps of AM rate preferences are displayed on cortical surfaces; color indicates the rate eliciting the greatest BOLD activity. Reversals from A are displayed, marking contours sharing similar responses to AM rate in B. C, Distributions are plotted for vertices exhibiting local gradient directions 0–360°, weighted by the strength of the gradient at each vertex. Functions containing mixtures of two (black dashed lines) or four (red lines) Gaussians were fitted to the shape of these distributions to assess overall patterns in gradient direction. A goodness of fit (r2 value) for two- and four-Gaussian mixtures is displayed in the upper right corner of each box. Additional goodness-of-fit measures were compatible with r2 values; the AIC and BIC were less for four- than two-Gaussian models, indicating a better fit (AIC, −1.92 and −3.08 for two- and four-Gaussian models; BIC, −1.86 and −2.95 for two and four-Gaussian models, respectively). A, Anterior; M, medial; P, posterior; L, lateral.

