
Figure 7.
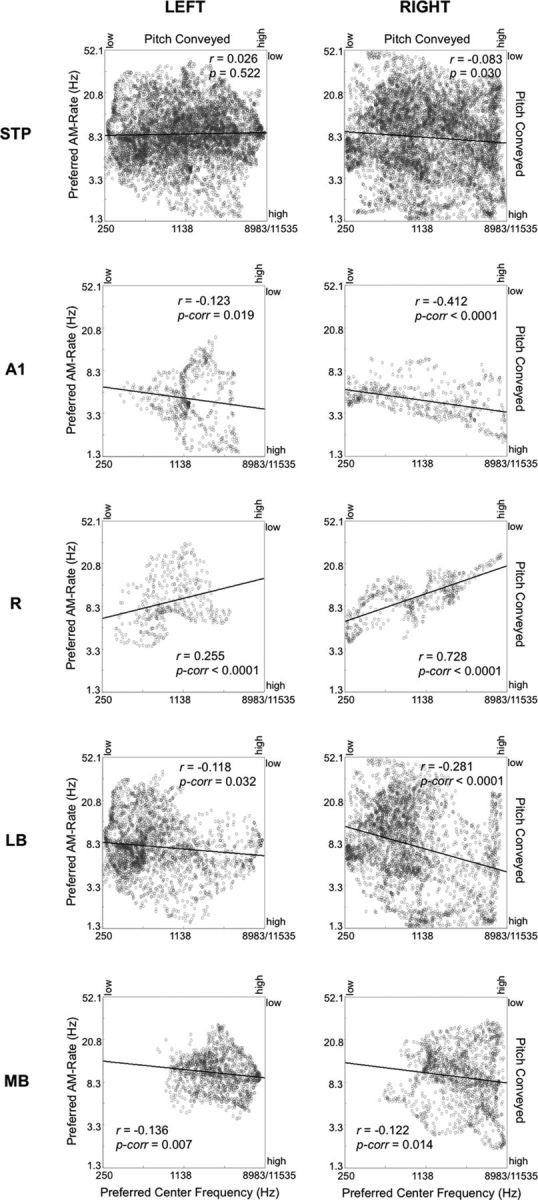
Spatial correspondence between AM-rate maps and tonotopic maps for all of auditory cortex (top row) and selected regions/areas of auditory cortex (bottom rows). Scatter plots are shown, where each data point represents each voxel's preferred rate of AMWN (left y-axis) and preferred spectral center frequency (bottom x-axis). Dominant pitch conveyed is also displayed for AMWN (right y-axis) and center frequency (top x-axis). Negative correlations suggest that AM-rate preference might be explained by spectral/pitch information conveyed by AMWN stimuli. Data for preferred center frequency were taken from group tonotopic maps including all stimulus bandwidths (i.e., PT, N-BPN, and B-BPN). Black lines mark the best linear fit to each scatter plot (Pearson's r). Auditory cortical fields analyzed include the entire STP, putative core subfields A1 and R, the lateral belt (LB), and the medial belt (MB).