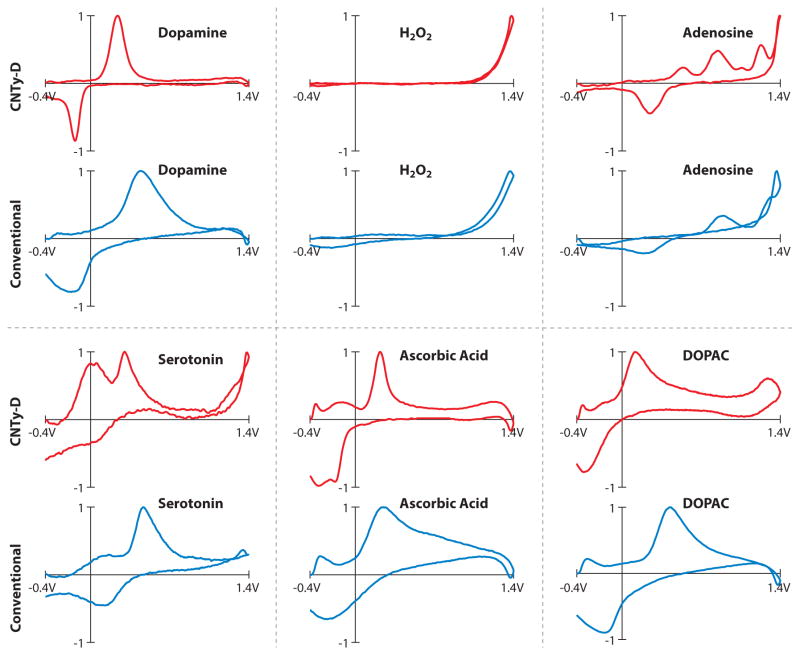
Figure 1.
Voltammograms for several analytes commonly encountered in brain tissue. Data collected using CNTy-D electrodes are shown in red, and those collected using conventional carbon-fiber electrodes are shown in black. Potential was scanned from −0.4 V to +1.4 V and back at 400 V/s and applied at 10 Hz to allow for the detection of many analytes. Currents are normalized to highlight differences in the features of each voltammogram. Figure reprinted with permission from Reference 71. Abbreviations: CNTy-D, carbon-nanotube yarn-disk; DOPAC, 3,4-dihydroxyphenylacetic acid.

