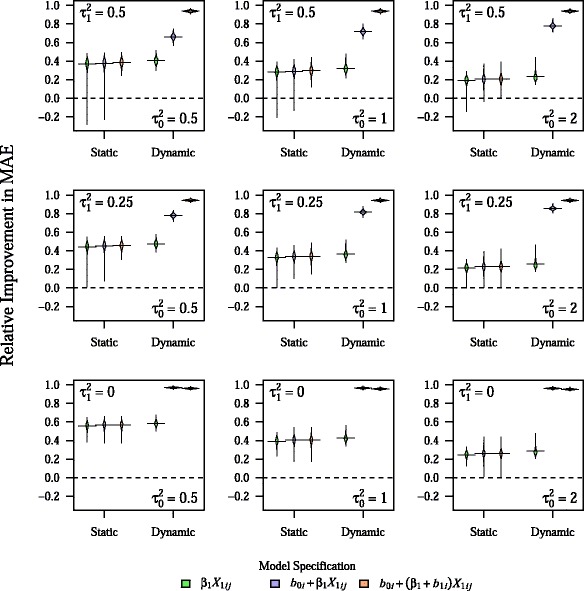
Fig. 1.

Relative improvement in MAE for both dynamic and static models across all main parameter combinations. Plots show the density of values for relative improvement in MAE across 1,000 simulations, with horizontal bars representing the mean value. All other parameters are fixed at their base values. The center figure represents the base parameter combination
