Fig. 1.

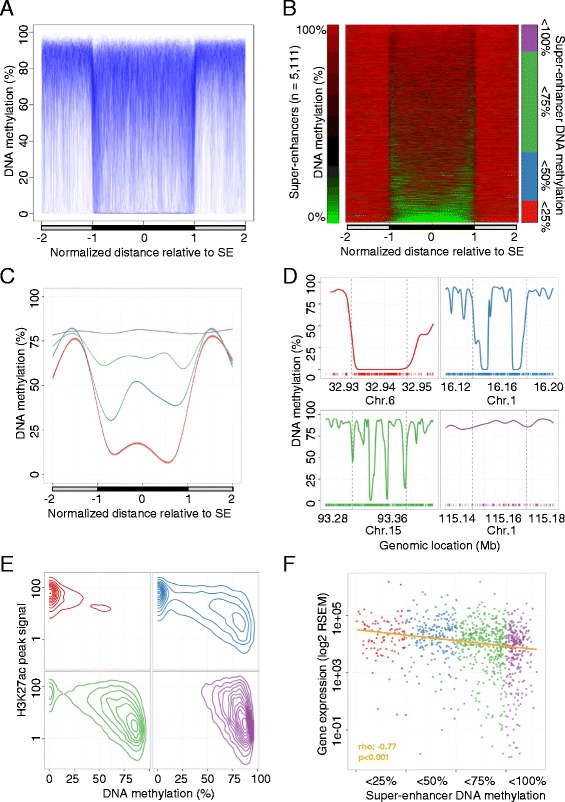
DNA methylation profile of super-enhancer regions derived from normal tissues determined by whole genome bisulfite sequencing (WGBS). a Scaled DNA methylation profile of 5111 super-enhancers (SE) in their respective normal tissues (n = 5). Each super-enhancer is represented by a single line (blue) and smoothed DNA methylation levels inside the super-enhancer (black bar) and equally sized flanking sequences (gray bar) are displayed. b DNA methylation levels of super-enhancers in their respective normal tissues (n = 5) in equally sized windows (green, 0 %; red, 100 %). Each horizontal line represents a single super-enhancer, ordered by average DNA methylation levels. Super-enhancers are grouped according to their average DNA methylation levels (red, <25 %; blue, <50 %; green, <75 %; purple, <100 %). c Smoothed average DNA methylation profile of all super-enhancers categorized into four groups on the basis of DNA methylation levels. d Examples of the DNA methylation profiles of breast super-enhancers representing the defined subgroups. Genomic locations of the super-enhancers (dashed vertical lines) and equally sized flanking regions are displayed and CpG dinucleotides locations are indicated (bottom, colored bars). e Association between DNA methylation levels and H3K27ac peak signals [11] in normal breast tissues and breast super-enhancers (n = 1091) displayed as averaged values (50-bp windows). Super-enhancers were classified into previously defined subgroups. f Gene expression levels of target transcripts in normal breast tissues. Scaled averaged expression levels of genes associated with breast super-enhancers (n = 1091) in normal breast tissue samples (n = 110; TCGA [16]). Super-enhancers were grouped according to their average DNA methylation levels. Significance of a Spearman’s correlation test is indicated. RSEM RNA-Sequencing by Expectation Maximization
