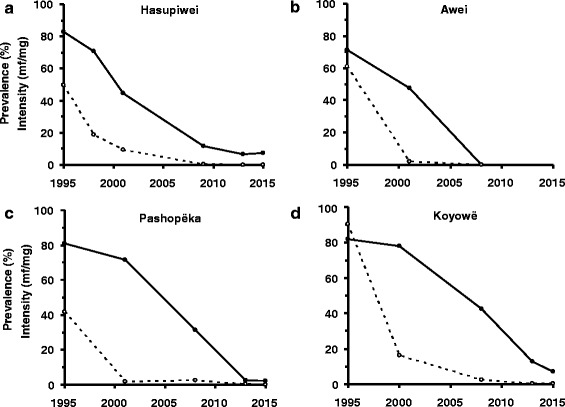
Fig. 4.

Temporal trends of Onchocerca volvulus infection in sentinel communities of the Venezuelan part of the Amazonian focus. For each panel, the baseline values of microfilarial prevalence (%) and intensity (arithmetic mean no. mf/mg) were averaged and plotted for 1995. The solid lines and circles represent infection prevalence, and the dotted lines and open circles represent infection intensity. (a) Hasupiwei; (b) Awei; (c) Pashopëka; (d) Koyowë
