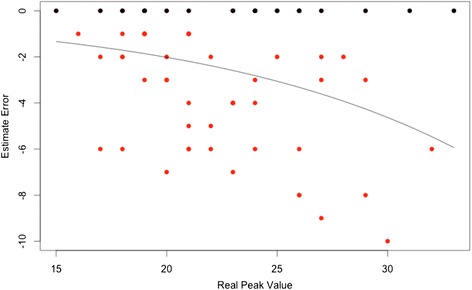
Fig. 2.

Scatterplot for Estimate Error of Strategy 1. Black dots represent the correct estimates (zero error), red dots the incorrect estimates. The black line represents the prediction from the ZICP model showing the non linear dependency of the non zero error on the real peak value. Note the skewed distribution around the mean
