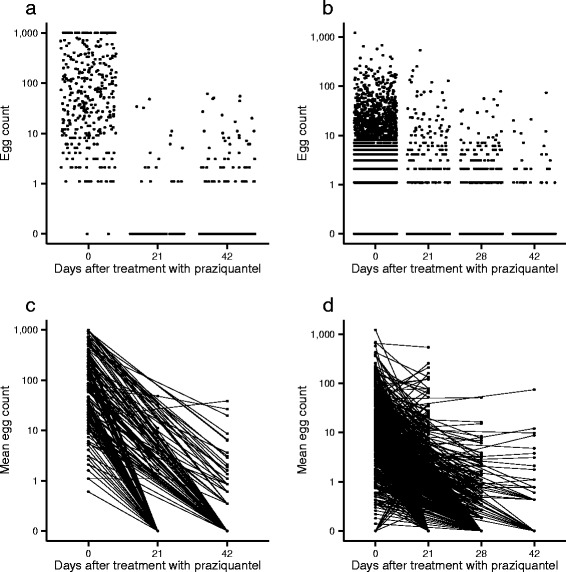
Fig. 2.

Schistosome egg counts by number of days after treatment with praziquantel. Panel a depicts Schistosoma haematobium egg counts measured by urine filtration. Panel b depicts S. mansoni egg counts measured by Kato-Katz technique. Each data point represents a single count (i.e. not an average of multiple counts). Panels c and d depict the arithmetic mean egg counts per person connected by a line. Treatment with praziquantel occurred following the counts made at day zero
