Figure 2.

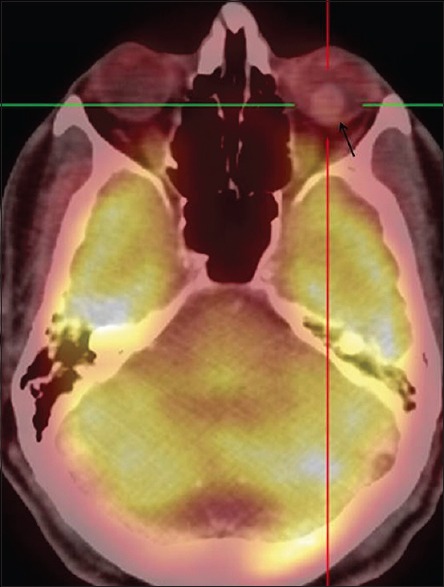
Fused positron emission tomography-computed tomography image of case 1 showing moderate fluorodeoxyglucose uptake in the intraocular mass in left eye (black arrow) with maximum standardized uptake value 3.4

Fused positron emission tomography-computed tomography image of case 1 showing moderate fluorodeoxyglucose uptake in the intraocular mass in left eye (black arrow) with maximum standardized uptake value 3.4