
Fig. 3.
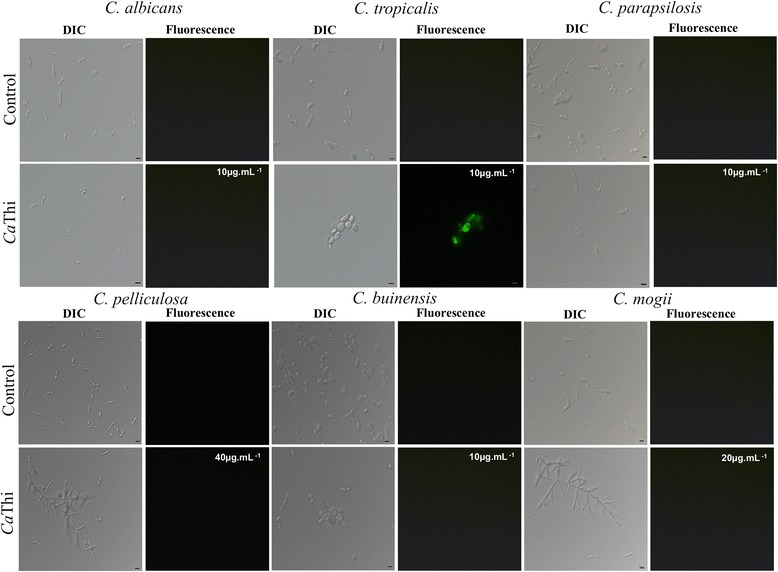
Oxidative stress assay. Photomicrography of different yeast cells after reactive oxygen species assay detection by fluorescence microscopy using the fluorescent probe 2′,7′ dichlorofluorescein diacetate (H2DCFDA). Cells were treated with CaThi for 24 h and then assayed for ROS detection. Control cells were treated only with probe (H2DCFDA). Bars 5 μm