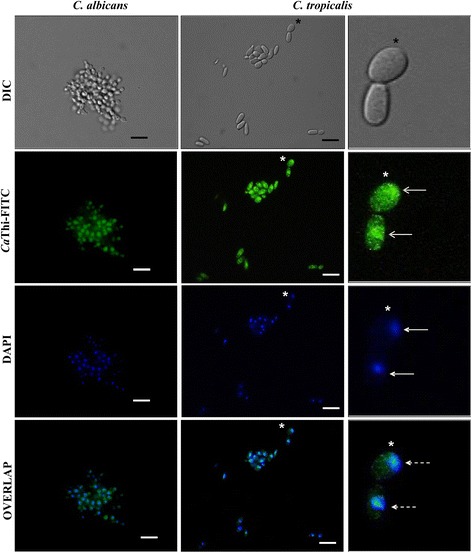
Fig. 4.

Localization of CaThi in yeast cells. Photomicrography of Candida albicans and Candida tropicalis cells incubated for 24 h with 10 μg.mL−1 CaThi-FITC (green fluorescence, open arrows) by fluorescence microscopy. Nuclei were visualized by 4′,6-diamidino-2-phenylindole dihydrochloride (DAPI) after the CaThi-FITC incubation period (blue fluorescence, filled arrows). Overlap of the DAPI and FITC images (dotted arrows). Bars 20 μm. (*) Indicates the position of digital enlargement
