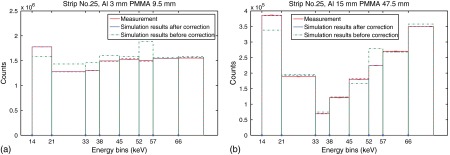
Fig. 6.
Spectral responses in the central strip of the detector module by both measurement and simulation. (a) is the result for a transmission spectrum attenuated by 3-mm Al and 9.5-mm PMMA. (b) is the result for a transmission spectrum attenuated by 15-mm Al and 47.5-mm PMMA. Error bars are given by the Poisson variance of the measured number of photon counts, almost not visible in the figures.

