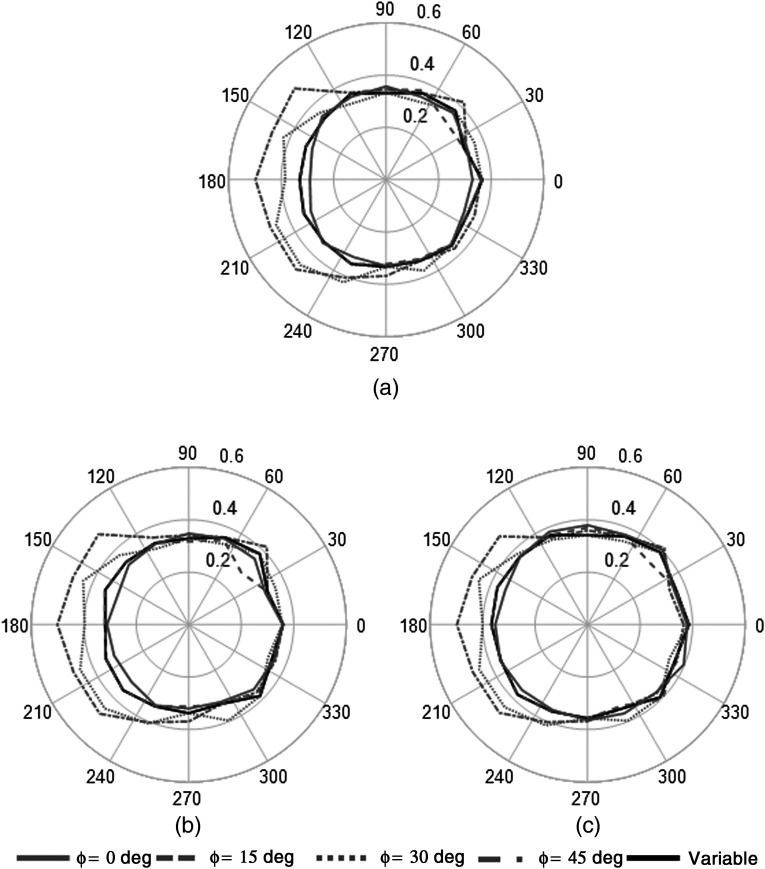
Fig. 11.
Polar plots of measured value as a function of detector position. The value (radial component of the data) increased at detector positions with direct views of the heart and liver, which may impact the application of the DEW method using a single global value. Note the relatively constant value for the variable trajectory. (a) No lesion, (b) 1-cm lesion, (c) 4-cm lesion.

