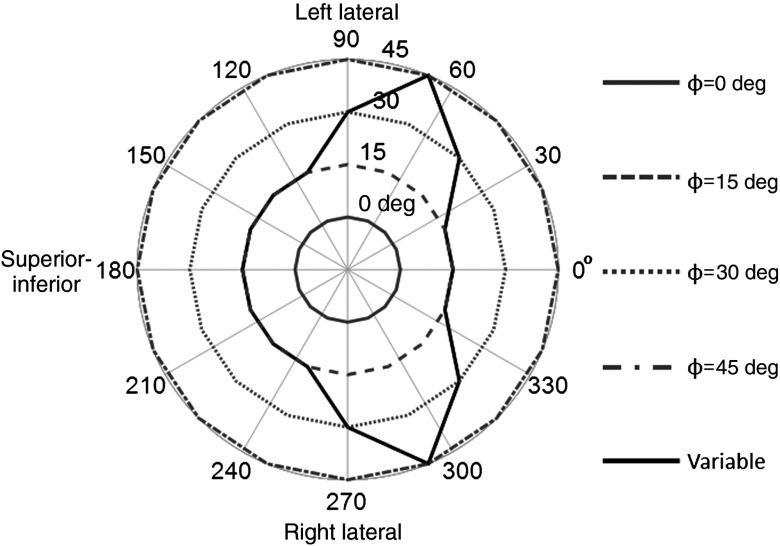
Fig. 4.
Polar plots of five trajectories simulated from the detector positions with the radius indicating detector tilt ( to 45 deg) about the to 360 deg azimuth. These trajectories were used for determining the impact of changes in the scatter distribution on the application of the dual-energy window (DEW) method. Four trajectories utilize a fixed detector tilt. The variable trajectory was created to minimize direct views of the heart and liver, as is typically done on our physical system for patient imaging. The projection orientation relative to the patient anatomy is also given for three detector positions.

