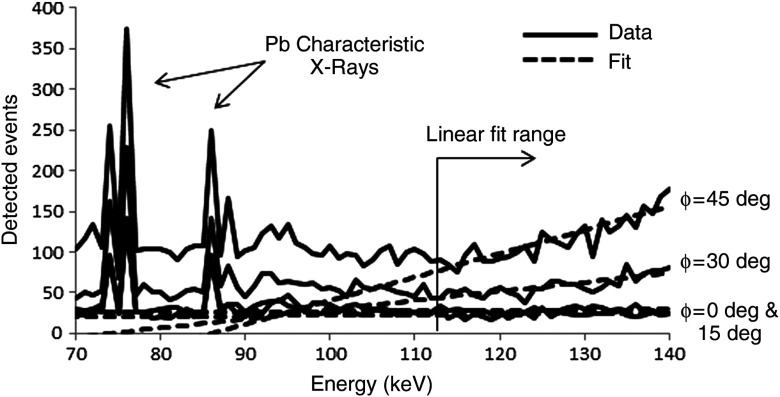
Fig. 6.
Example of total spectra with corresponding linear fits from simulations. The linear fit range corresponds to the scatter energy range. Characteristic x-rays from the lead collimator are also seen in the spectra. Note that these spectra are composed entirely of scattered events; the monochromatic 140-keV photopeaks are off scale () and not shown in order to better visualize the fitted scatter region.

