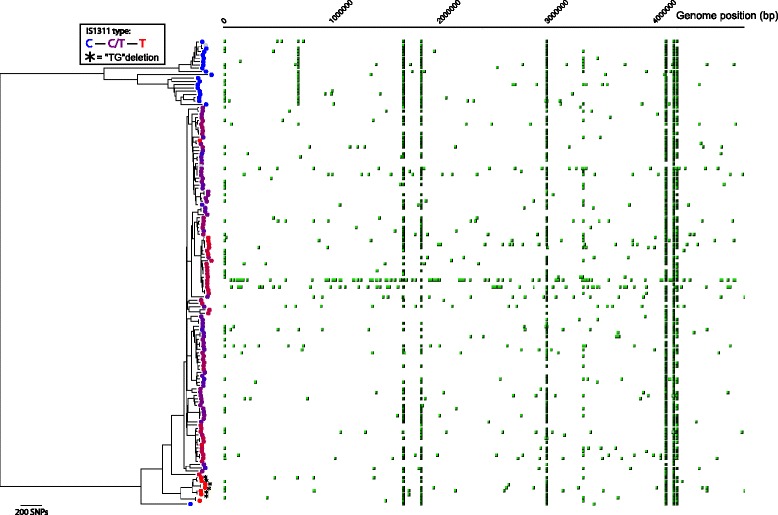
Fig. 2.

Type and genomic position of IS1311 element found in the Map sequencing data. The proportion of reads mapping to the IS1311 element with a T or C at position 223 is indicated by the colour gradient of circles displayed on the phylogenetic tree. Asterisks indicate samples where the “TG” deletion was detected [22]. The position of the IS1311 element in the genome was predicted by identifying paired reads where one read maps to the IS1311 element and the other does not, and using the mapped position of the latter. This is displayed horizontally with the genome co-ordinates displayed along the top. The colour intensity of the predicted IS1311 element position represents the relative number of supporting reads detected within the sample, and thus is normalised for differences in depth of coverage between samples
